

Commodities Across the Cycle: A Macro Regime Guide (2026)
Data as of 25 July 2026. This guide synthesises the macro-regime, correlation and risk sections of the individual commodity guides on this blog, as those guides stood after their July 2026 refresh. Correlations and regime “performance” are historical tendencies and estimates, not forecasts or guarantees — they are sample-dependent and break down in crises. This report is for information only and was prepared with AI assistance — see the disclaimer at the end.
Most commodity writing treats each raw material in isolation. But investors don’t hold a commodity in a vacuum — they hold it inside a portfolio, during a particular economic weather system. The question that actually matters is which commodities work in which regime: when inflation runs hot, when growth booms or breaks, when real rates rise, when the dollar surges. This guide answers that across five very different commodities — gold, copper, uranium, oil and natural gas — and shows how they relate to each other and to equities. It is the cross-asset companion to the single-commodity deep-dives; for the company-level data behind each market, screen producers by production, reserves and cost on Metal Pilot .
The headline: these five are not one trade. Gold is a monetary hedge, copper and oil are pro-cyclical growth plays, uranium is an idiosyncratic, event-driven diversifier, and natural gas is a weather- and storage-driven regional market. That diversity is the point — it is what lets a commodity sleeve do different jobs in different regimes.
TL;DR & Key Takeaways
- They answer to different masters. Gold tracks real interest rates and the dollar; copper and oil track the global growth cycle (copper especially China); uranium tracks the nuclear fuel cycle, not the economy; natural gas tracks weather, storage and LNG, not the macro cycle.
- Best regime, in one line: gold loves stagflation, falling real rates and crises; copper and oil love expansions and reflation; uranium rises on reactor build-out and supply discipline regardless of GDP; gas spikes on cold winters and supply shocks.
- Correlation to stocks: gold is roughly uncorrelated with the S&P 500 and Nasdaq (its diversification superpower); copper (≈ +0.5) and oil (≈ +0.3) are positively linked to equities; uranium (≈ +0.2) and gas (≈ +0.1) are largely independent.
- They are not clones of each other: copper–oil move together (≈ +0.5); gold has only a loose link to the industrials (≈ +0.3); uranium and gas are weakly tied to everything — which is exactly why they diversify.
- The dollar is the common hinge: all five are dollar-priced, so a strong dollar is a shared headwind (strongest for oil ≈ −0.6 and gold/copper ≈ −0.4, weakest for gas and uranium).
- Different risks, not one risk: copper fears a China/recession demand shock; oil fears demand destruction and OPEC policy; gold fears a return of high real rates; uranium fears an accident or a policy reversal; gas fears mild weather, volatility and methane regulation.
New to the topic? Read straight through from Section 1. Here for the positioning takeaway? Jump to Section 5. All terms are defined in the Vocabulary (Section 8).
Figure 1. How the five commodities behave across macro regimes
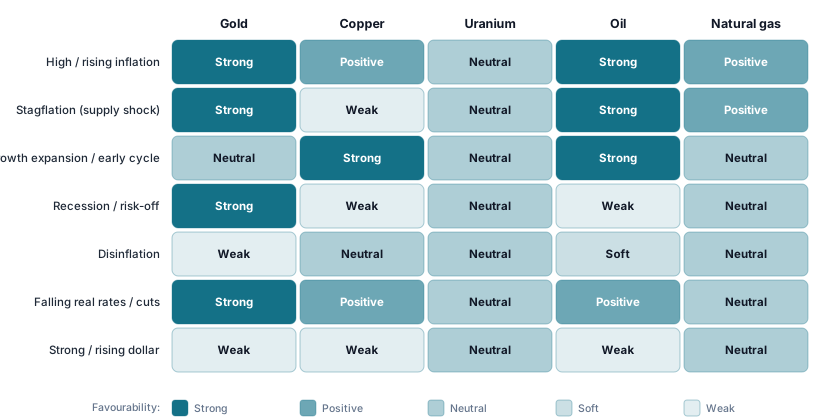
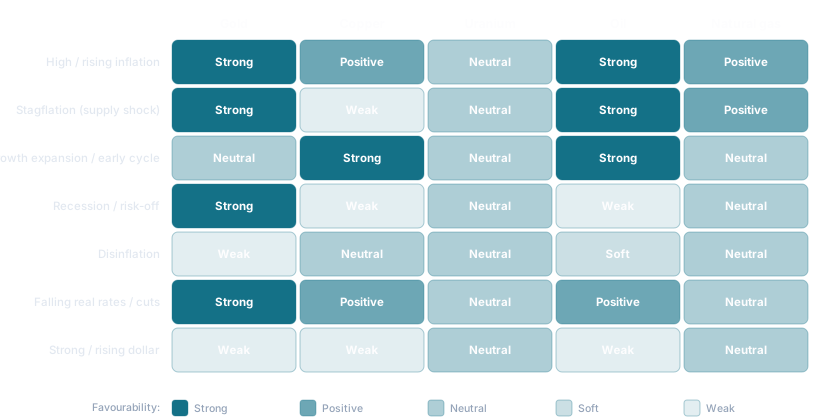
Figure data: Table 1.
1. How to read commodities through a macro lens
A commodity’s price is the meeting point of its own supply and demand with the macro weather — the prevailing mix of growth, inflation, interest rates and the dollar. The same metal can soar in one regime and sink in another with no change in its fundamentals, simply because the opportunity cost of holding it, or the strength of industrial demand, has shifted. Reading commodities through this lens means asking two questions of any environment: what is growth doing, and what are prices (and therefore real rates) doing?
1.1 The regimes that matter
The economic “weather systems” worth distinguishing — and the ones used throughout this guide — are a small set:
- Growth expansion — rising output, employment and industrial activity; demand for raw materials climbs. The early-cycle recovery out of a recession is usually the most powerful phase for cyclical commodities.
- Recession / risk-off — falling demand and a flight from risk assets; cyclical commodities fall hard while safe havens are bid.
- High / rising inflation — broad prices rising; real assets tend to hold value, especially when the inflation is energy-driven.
- Disinflation — inflation cooling from a high level (prices still rising, but more slowly); generally neutral-to-soft for commodities.
- Deflation — broadly falling prices with weak demand; negative for almost everything except cash and high-quality bonds.
- Stagflation — the rare, toxic mix of weak growth and high inflation, usually from a supply shock; the regime where real assets (gold, oil) most clearly outshine financial assets.
- Rate & dollar regimes — cutting through the above, the level and direction of real interest rates and the US dollar are the cross-asset hinges, especially for non-yielding gold and for every dollar-priced raw material.
1.2 Two axes: growth and inflation
A useful mental model collapses most of these into a 2×2 of growth and inflation. Rising-growth/rising-inflation (a hot expansion or reflation) favours copper and oil; rising-inflation/falling-growth (stagflation) favours gold and oil while punishing copper; falling-inflation/rising-growth (a “goldilocks” disinflationary boom) favours equities over commodities and is gold’s weakest backdrop; and falling-growth/falling-inflation (a deflationary bust) is negative for the cyclicals while gold’s safe-haven role competes with a rising real-rate headwind. Uranium and gas largely sit outside this grid — their drivers are the reactor fleet and the weather, not GDP and CPI.
Figure 2. The growth–inflation grid: which commodity each quadrant favours
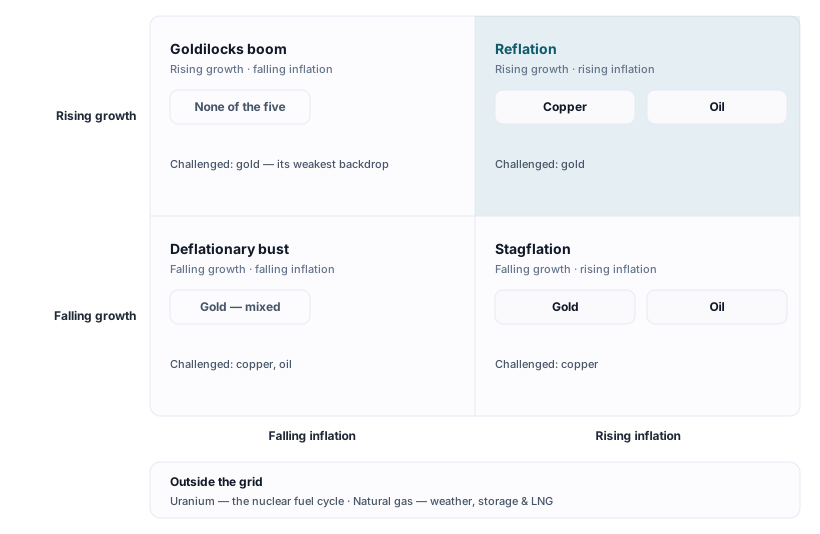
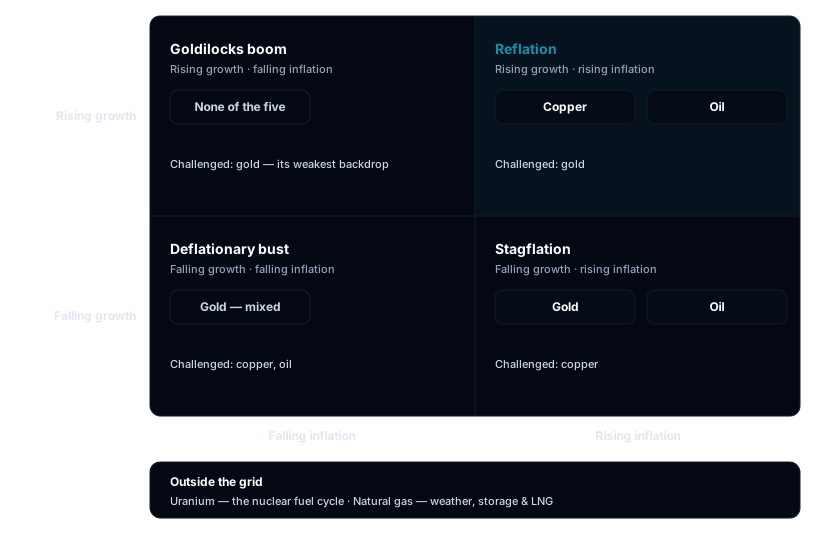
Figure data: Table 1 and Table 6; conceptual placement of historical tendencies, not measured values.
1.3 The dollar and real rates: the cross-asset hinge
Two macro variables sit underneath all five markets. The US dollar matters because every one of these commodities is priced in dollars: when the dollar strengthens, the same barrel or tonne costs more in other currencies, curbing demand — so a strong dollar is a shared headwind (most powerful for oil and gold, weakest for regional gas and idiosyncratic uranium). Real interest rates — the nominal rate minus expected inflation — matter most for gold, which pays no yield: when real rates fall, the opportunity cost of holding gold drops and it tends to rise; when real rates climb, gold struggles. Rates reach the cyclicals (copper, oil) more indirectly, through their effect on growth and the dollar.
The two hinges are not equally strong across the five, and the gap is what makes the group worth holding together. Oil’s inverse link to the dollar (≈ −0.6 on monthly data, Table 4) is one of the most durable relationships in markets, and gold’s and copper’s (≈ −0.4 each) are close behind; uranium’s and gas’s are barely there (≈ −0.1), because a Kazakh pound of uranium is sold on long-term contracts and a Louisiana molecule of gas is consumed a few hundred miles from where it was drilled. Real rates split the group even more sharply: gold’s ≈ −0.5 link is the tightest single relationship in the whole matrix, while uranium and gas show essentially none. The practical consequence is that a Federal Reserve pivot is a direct trade in gold and only a second-order one in the rest.
2. The five commodities across economic regimes
The single most useful view is the regime matrix: each commodity’s typical behaviour in each economic weather system. The pattern below is drawn from concluded historical episodes, not live forecasts, and the cells describe tendencies that can be overridden by a commodity’s own supply story (as electrification did for copper in 2022–2025, when tight money should have hurt it).
Table 1. The five commodities across economic regimes
| Regime | Gold | Copper | Uranium | Oil | Natural gas |
|---|---|---|---|---|---|
| High / rising inflation | Strong | Positive | Neutral | Strong | Positive |
| Stagflation (supply shock) | Strongest | Weak | Neutral | Strong | Positive |
| Growth expansion / early cycle | Neutral | Strong | Neutral | Strong | Neutral |
| Recession / risk-off | Strong | Weak | Neutral | Weak | Neutral |
| Disinflation | Weak | Neutral | Neutral | Soft | Neutral |
| Falling real rates / rate cuts | Strong | Positive | Neutral | Positive | Neutral |
| Strong / rising dollar | Weak | Weak | Neutral | Weak | Neutral |
Source: synthesised from the individual commodity guides on this blog (Macro-regime sections), with price series from LBMA , IMF/LME , UxC/TradeTech , the Energy Institute Statistical Review 2025 and U.S. EIA , and macro data from FRED . Historical tendencies, not forecasts. For uranium and natural gas, “Neutral” means largely independent of that regime rather than mildly positive — both markets sit outside the growth/inflation grid, as their own guides state; each cell is substantiated in Sections 2.1–2.4.
2.1 Inflation & stagflation
When inflation runs hot, real assets tend to defend purchasing power. Oil is often the inflation itself — energy is both a cause and a direct component of CPI — so it is one of the more reliable inflation hedges, strongest when the inflation is energy-driven (the 1970s, 2021–22). Gold is the classic store-of-value hedge, but with a condition: it works best when high inflation drives real rates negative. Natural gas can ride an energy-led inflation higher — Henry Hub’s annual average roughly tripled from $2.03/MMBtu in 2020 to $6.42 in 2022 — though its regional, weather-led nature makes it a less dependable macro hedge.
The decisive split is stagflation — weak growth plus high inflation. Here gold has historically performed best of all (1973–1980), combining its inflation hedge with a safe-haven bid, and oil can surge if a supply shock is the cause. Copper , by contrast, struggles: it is a growth metal, and stagflation means the growth half of the equation is failing, so industrial demand weakens even as prices broadly rise. Uranium mostly ignores the whole question — reactor fuel demand is inelastic and set years ahead.
What actually happened. The energy-led inflation of 2021–22 is the cleanest modern case: Brent’s annual average ran from $42.0/bbl in 2020 to $100.9 in 2022, and energy was the best-performing S&P 500 sector in 2022, returning roughly +66% while the index itself fell ~18% (the equities, Table 3). Gold, however, was flat in 2022 despite ~8% US inflation, because the Federal Reserve drove real rates sharply positive — the textbook proof that gold needs negative real rates, not merely high CPI. In the 1970s stagflation, gold rose more than twentyfold (from $35 in 1971 toward $850 in 1980) while equities went nowhere in real terms; copper had no comparable decade because the growth ingredient was missing. That is why the matrix rates oil and gold “Strong” in inflation/stagflation but copper “Positive→Weak”, and uranium “Neutral”.
2.2 Growth expansion & early cycle
A broad expansion, and especially the early-cycle recovery out of a recession, is the home turf of the pro-cyclical commodities. Copper is the archetype — “Dr. Copper”, with a PhD in economics — rising on the industrial restock-and-build phase and, above all, on Chinese strength (China is ~58% of refined copper demand). The 2003–2007 supercycle and the 2009–2011 stimulus rebound are the textbook cases. Oil likewise climbs as travel, trade and industry lift fuel demand. Gold tends to lag in a confident, high-real-rate expansion (its 2013–2015 bear), while uranium and gas march to their own drummers — uranium to nuclear-build sentiment, gas to weather and storage.
What actually happened. In the 2003–2011 China supercycle, copper rose roughly five-fold from its 2001–03 lows to the 2011 peak above $10,000/t — and the equities amplified it: copper miners are high operating-leverage plays whose profits (and share prices) swing more than the metal (Table 3). The 2020–21 reflation rhymed — copper roughly tripled off its pandemic low and Freeport-McMoRan and peers ran even harder. Oil and the energy sector rose with them. Gold, by contrast, underperformed in the confident, high-real-rate stretch of 2013–2015, and its miners only re-rated once real rates rolled over in 2019–2020 — which is why the matrix rates copper and oil “Strong” in expansion but gold only “Neutral”.
2.3 Recession, deflation & risk-off
A downturn is where these five separate most sharply. Gold is bid as a safe haven (2008, 2020), one of the few assets that can rise while equities fall — the source of its diversification value. Copper and oil fall hard on demand destruction; copper can lose half its value in a genuine recession or a deep Chinese slowdown (2008–09, 2015), and oil dropped below $40 in 2008 and printed negative in April 2020. Natural gas is largely indifferent to the macro cycle — its demand is weather- and power-led — though a deep recession trims industrial use. Uranium is the standout: reactor fuel demand is so inelastic that uranium is largely independent of recessions (it dipped only briefly in 2020 before recovering fast). In outright deflation, almost everything cyclical falls; gold’s safe-haven role competes with the headwind of rising real rates.
What actually happened. 2008 is the textbook split: as the S&P 500 lost ~37%, gold ended the year higher (≈ +5%) — yet the gold miners fell hard with the market in the liquidity scramble even though the metal held — the clearest proof that a miner is not the metal (Table 3). LME copper fell ~67% between its July 2008 peak ($8,900/t) and the December trough ($2,800/t), and Freeport-McMoRan fell ~85%. 2020 rhymed: gold hit records (≈ +25%) and the miners tracked it, while energy was the worst-performing S&P 500 sector (≈ −34%) as oil briefly went negative and Chesapeake Energy — a decade earlier the second-largest US gas producer — filed for Chapter 11 — before energy flipped to the best sector in 2022. Uranium barely registered either downturn, dipping only briefly in 2020 before resuming its own up-cycle. That asymmetry is why the matrix rates gold “Strong”, copper and oil “Weak”, and uranium “Neutral” in a recession.
2.4 Rates, the dollar & disinflation
Cutting across the growth cycle are the monetary regimes. Falling real rates and rate-cut cycles are unambiguously good for gold (lower opportunity cost) and supportive of copper and oil to the extent the cuts revive growth. A strong, rising dollar is a shared headwind for all dollar-priced commodities — most punishing for oil (its inverse-dollar link is one of the most durable in markets, ≈ −0.6) and gold/copper (≈ −0.4), and least relevant for regional gas and idiosyncratic uranium. Disinflation with solid growth — a “goldilocks” backdrop — is gold’s weakest regime and roughly neutral for the cyclicals.
What actually happened. The dollar-and-rates regime showed its teeth in 2011–2016: a strengthening dollar and disinflation drove gold ~−45% from its 2011 peak, and the HUI gold-miners index fell ~−84% into its January 2016 trough — the amplification working brutally in reverse (Table 3) — while copper ground down into its 2016 trough. The clearest break from the rule is 2022–2025, when gold roughly doubled again to successive records despite high nominal rates, because central-bank buying and de-dollarisation overrode the rate signal, and copper set records of its own (annual averages of $9,142/t in 2024 and ~$9,947/t in 2025) even as money stayed tight — the exception that proves these are tendencies, not laws.
A compact reference for each commodity’s macro personality:
Table 2. Macro personality of each commodity
| Commodity | Type | Best regime | Worst regime | Key macro lever | Volatility |
|---|---|---|---|---|---|
| Gold | Monetary hedge | Stagflation; falling real rates; crisis | Strong growth + high real rates + strong USD | Real interest rates | Moderate |
| Copper | Pro-cyclical industrial | Expansion / reflation; China stimulus | Recession; China slowdown | Global & Chinese growth | High |
| Uranium | Idiosyncratic / event-driven | Reactor build-out; supply discipline | Post-accident / policy reversal | The nuclear fuel cycle | Very high |
| Oil | Pro-cyclical + supply-shock hedge | Expansion; supply-shock inflation | Recession; demand destruction | Growth & OPEC+ supply; the dollar | High |
| Natural gas | Weather / storage / regional | Cold winter; regional supply shock | Mild weather + full storage | Weather, storage, LNG | Very high |
Source: synthesised from the individual commodity guides on this blog (Macro-regime and price-driver sections). Qualitative and historical.
2.5 The equities: how commodity stocks behaved
A crucial nuance runs through every example above: owning the commodity and owning its producers are not the same trade. Miners, drillers and producers carry operating leverage — their costs are largely fixed, so when the commodity price rises, profits (and share prices) rise faster; when it falls, they fall faster. Commodity equities are therefore higher-beta proxies for the same regime call — more rewarding in the right environment and more punishing in the wrong one. Two caveats matter: in a liquidity crisis the stocks can fall with the broad market even when the metal itself holds (gold miners in 2008), and diversified majors (oil supermajors, big diversified miners) dampen the swing relative to single-commodity pure-plays and E&Ps.
Table 3. How commodity equities have behaved across regimes
| Commodity | Typical equity proxy | Beta to the commodity | Illustrative concluded episodes (equity performance) |
|---|---|---|---|
| Gold | Gold miners (NYSE Arca HUI index) | High — historically 2–3× gold | 2000 low → 2011 peak: gold ≈ +640%, HUI ≈ +1,500%; 2011 peak → Jan 2016 trough: gold ≈ −45%, HUI ≈ −84% |
| Copper | Copper miners (e.g. Freeport-McMoRan) | High — operating leverage | Jul–Dec 2008: LME copper ≈ −67%, Freeport ≈ −85%; 2020–21 reflation: copper ≈ tripled off its low, Freeport further still |
| Uranium | Uranium miners (e.g. Cameco) & juniors | Very high (≈ +0.8 corr) | 2011–16 post-Fukushima: spot ≈ −55% on annual averages, Cameco ≈ −75%, juniors ≈ −90%; 2020–24: spot ≈ $30 → $84/lb, Cameco ≈ 6× off its 2020 low |
| Oil | Energy sector; E&Ps vs. majors | Moderate (majors) to high (E&Ps) | 2014–16: Brent ≈ −75%, S&P Oil & Gas E&P index ≈ −70 to −75%, supermajors only ≈ −30 to −40%; S&P 500 energy sector worst in 2020 (≈ −34%), best in 2022 (≈ +66%) |
| Natural gas | Gas producers (e.g. EQT) | Very high to a volatile price | 2020 trough → 2022: Henry Hub annual average $2.03 → $6.42/MMBtu, EQT ≈ 5×; June 2020: Chesapeake Energy filed for Chapter 11 |
Source: episode magnitudes as stated in the individual gold, copper, uranium, oil and natural-gas guides on this blog, traced there to LBMA, LME/IMF, UxC/TradeTech and U.S. EIA price series and to NYSE/TSX price histories; annual S&P 500 sector returns from Novel Investor ; gold annual returns from the World Gold Council . Concluded episodes, approximate — past performance is not indicative of future results.
The takeaway: the regime map applies more intensely to the equities than to the commodities — the stocks are the leveraged expression of the same call, so a regime that is mildly positive for the metal can be powerfully positive (or negative) for the miners.
Three things break that link, and each has a concluded example. Liquidity crises sever it outright: in 2008 the metal did its job (gold ≈ +5% on the year) while the miners were sold down with everything else, because a forced seller sells what has a bid, not what has a thesis. Balance sheets and hedge books blunt it: gas producers that sold their 2022 output forward at 2021 prices captured only a fraction of the spike, which is why the sector gave much of its gain back into the 2023–24 glut. And business mix dampens it: through the 2014–16 oil bust the E&P pure-plays fell roughly as far as crude itself (≈ −70 to −75%) while the integrated supermajors lost only ≈ −30 to −40%, their refining and chemicals earnings rising as feedstock got cheaper. A producer is a leveraged bet on the commodity plus a bet on management, jurisdiction and capital structure — which is the argument for screening the companies rather than assuming the beta.
3. How they move together — correlations
Regime behaviour explains why these commodities move; correlations measure how much they move together, and with the rest of a portfolio. The numbers below are approximate, based on monthly data over 2000–2024, and — this matters — they are time-varying and converge toward +1 in a crisis, when “everything sells off together”. They are best read as the normal-times structure, not a guarantee.
3.1 Correlation to equities (S&P 500 & Nasdaq)
The most important relationship for a portfolio is the link to stocks. Gold is the prize diversifier: its correlation with the S&P 500 — and with the tech-heavy Nasdaq — is roughly zero, so it tends to hold or rise when equities fall. The cyclicals are positively correlated with equities because they share the growth cycle: copper ≈ +0.5 and oil ≈ +0.3 with the S&P 500, a touch lower against the Nasdaq (whose tech weighting is less commodity-sensitive). Uranium (≈ +0.2) and natural gas (≈ +0.1) are only weakly tied to stocks — uranium because it answers to the fuel cycle, gas because it answers to the weather — which makes both genuine, if volatile, diversifiers.
3.2 The cross-asset correlation matrix
Among the commodities themselves, the tightest pair is copper–oil (≈ +0.5), the two growth-geared cyclicals. Gold has only a loose, reflation-dependent link to the industrials (≈ +0.3). Uranium and gas are weakly correlated with everything — the clearest sign that their drivers are internal. Every commodity is negatively correlated with the dollar (the shared dollar-pricing effect), and gold alone carries a strong negative link to real rates (≈ −0.5), the relationship that anchors its whole investment case.
Figure 3. Cross-asset correlation matrix (monthly, 2000–2024, approximate)
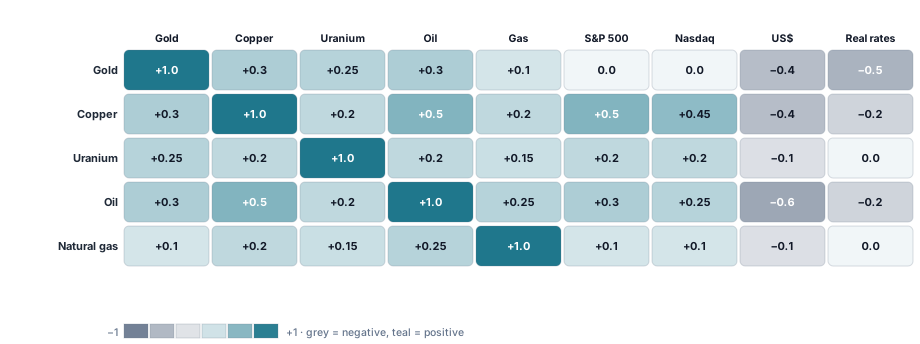
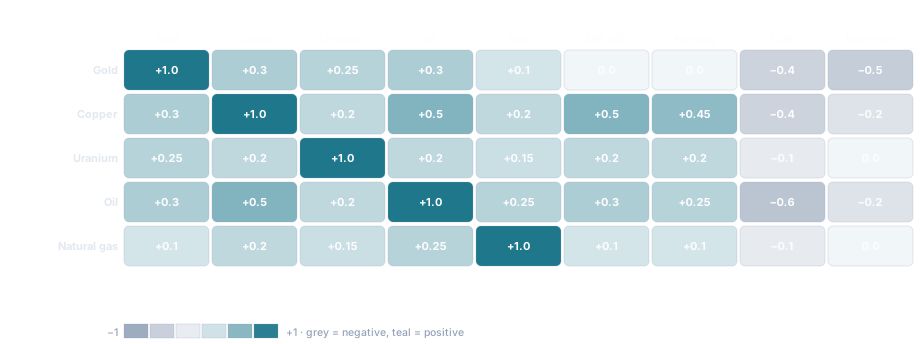
Figure data: Table 4.
Table 4. Cross-asset correlations (monthly, 2000–2024, approximate)
| Gold | Copper | Uranium | Oil | Nat. gas | S&P 500 | Nasdaq | US dollar | Real rates | |
|---|---|---|---|---|---|---|---|---|---|
| Gold | +1.0 | +0.3 | +0.25 | +0.3 | +0.1 | ~0.0 | ~0.0 | −0.4 | −0.5 |
| Copper | +0.3 | +1.0 | +0.2 | +0.5 | +0.2 | +0.5 | +0.45 | −0.4 | −0.2 |
| Uranium | +0.25 | +0.2 | +1.0 | +0.2 | +0.15 | +0.2 | +0.2 | −0.1 | ~0.0 |
| Oil | +0.3 | +0.5 | +0.2 | +1.0 | +0.25 | +0.3 | +0.25 | −0.6 | −0.2 |
| Nat. gas | +0.1 | +0.2 | +0.15 | +0.25 | +1.0 | +0.1 | +0.1 | −0.1 | ~0.0 |
Source: synthesised from the correlation sections of the individual commodity guides on this blog, restated on one common basis (monthly, 2000–2024), with macro series from FRED . Gas is Henry Hub; oil is Brent; “real rates” is the 10-year TIPS yield; “dollar” is DXY. Two bases are reconciled here: the oil–gas cell of +0.25 is the midpoint of the oil guide’s ≈ +0.2 (Brent basis) and the gas guide’s ≈ +0.3 (Henry Hub basis), and the oil guide’s correlations carry no declared window, so they are restated on this window. The Nasdaq column, and the dollar and real-rate cells for uranium and gas, are author estimates not stated in the individual guides. All correlations are approximate, sample-dependent and converge in crises.
3.3 Ratios worth watching
Two ratios distil the cross-asset story into a single line. The gold/copper ratio rises when growth fears dominate (gold up, copper down) and falls in reflation — a quick risk gauge for the cycle. The gold/oil ratio plays monetary stress against energy stress: it spikes when a financial crisis bids gold, and falls when an energy shock bids oil. Within the energy complex, oil and gas are only loosely linked (≈ +0.2–0.3) because regional gas markets (Henry Hub vs. Europe’s TTF vs. Asia’s JKM) often diverge sharply — a reminder that “energy” is not one trade either.
3.4 When the correlations break
Every number in Table 4 is a long-run average, and averages hide the moments that matter most. In an acute crisis, correlations across risky assets converge toward +1: leveraged investors meeting margin calls sell whatever is liquid, and the fundamental story of each asset is briefly irrelevant. Both 2008 and March 2020 worked this way. Gold’s crisis credentials survive that test only on a full-year view — it fell in the dash-for-cash weeks of March 2020 alongside equities, then finished the year up ≈ 25%; the miners, as Table 3 shows, did not even manage the intra-crisis part.
Two practical conclusions follow. First, diversification is a normal-times property, not a panic-week guarantee — an allocation sized on the assumption that gold rises on the worst day of a crash will disappoint. Second, the correlations are time-varying in slower ways too: gold’s link to real rates has been visibly weaker since 2022, when official-sector buying became a competing driver, and copper’s link to Chinese industrial activity has strengthened as China’s share of refined demand climbed from ~12% in 2000 to ~58% today. Treat the matrix as a description of the recent past that needs re-estimating, not a constant.
4. Risks, controversies & ESG across the five
A regime map tells you when each commodity tends to work; a risk map tells you what can break the thesis. The five share some macro risks but carry very different specific and ESG exposures.
4.1 Shared macro risks
Three risks cut across the group. A global recession or demand shock is the dominant threat to the cyclicals (copper and oil), and a drag on gas; gold and uranium are the relative shelters. The magnitudes are not subtle — copper lost roughly two-thirds of its value in five months in 2008, and the 2020 lockdowns erased about 20% of world oil demand almost overnight. A strong, sustained dollar is a headwind for all five, sharpest for oil and gold, and it usually arrives with the tightening cycle that slows growth, so the two headwinds compound rather than offset. And substitution / efficiency is a slow, structural risk everywhere: aluminium replaces copper in some power cables and increasingly in EV components when the copper price runs too far; electrification erodes the road-transport demand that is about 44% of oil use; renewables plus storage compete with gas and, at the margin, with new nuclear; and thrifting quietly trims the metal or fuel content of equipment over time. Substitution rarely causes a crash — it caps the top of the cycle and shortens the peak.
4.2 Commodity-specific risks
Each market has its own dominant, idiosyncratic risk:
- Gold — a durable return to high positive real rates with a strong dollar (gold’s natural enemy), plus the 2020s-specific risk of a central-bank buying reversal, which has become a key prop.
- Copper — the cycle itself: high beta to global growth and, above all, to China, where a property/credit slowdown can halve the price; plus resource nationalism in Chile, Peru and the DRC.
- Uranium — unusually binary: a nuclear accident (Chernobyl 1986, Fukushima 2011) or a policy reversal can crush demand for years, and the market depends structurally on Russian enrichment (~40% of world capacity) the West is scrambling to replace.
- Oil — demand destruction in a recession, OPEC+ supply policy, and the long-run peak-demand debate as transport electrifies.
- Natural gas — extreme price volatility (a mild winter plus full storage can halve the price, as the record-low 2024 US market showed), geopolitical/infrastructure shocks (Europe 2022), and LNG overbuild.
4.3 ESG profiles compared
The environmental and social exposures differ as much as the markets. Copper and gold mining is water- and tailings-intensive — open-pit porphyry copper consumes large volumes of water in stressed regions like the Atacama, and gold’s artisanal sector (ASGM) is the largest source of man-made mercury pollution. Uranium carries radioactivity, groundwater and long-term waste-disposal questions plus proliferation concerns, set against its status as the most energy-dense, low-carbon, always-on power source. Oil and gas carry emissions exposure directly; for gas, methane leakage is the swing factor that determines whether it is a genuine “bridge fuel”, and fracking raises water and seismicity concerns. Each set of issues is genuinely contested, and reasonable analysts weigh them differently.
Table 5. Risk & ESG snapshot by commodity
| Commodity | Top financial risk | Top ESG / controversy | Substitution threat |
|---|---|---|---|
| Gold | Rising real rates; central-bank reversal | ASGM mercury; cyanide & tailings | Low (unique monetary role) |
| Copper | Recession / China slowdown | Water use; tailings; resource nationalism | Moderate (aluminium) |
| Uranium | Nuclear accident; policy reversal; Russian enrichment | Radioactivity; waste; proliferation | Low for existing reactors |
| Oil | Demand destruction; peak-demand; OPEC+ | Combustion emissions; spills | Rising (EVs, efficiency) |
| Natural gas | Volatility; LNG overbuild; geopolitics | Methane leakage; fracking | Rising (renewables + storage) |
Source: synthesised from the individual commodity guides on this blog (risk & ESG sections); qualitative assessment. Concluded examples (Cobre Panamá 2023, Fukushima 2011, Europe 2022) are historical.
4.4 How the five risks compare
The risks in Table 5 differ not only in kind but in shape — how likely they are against how much damage they do — and that shape is what should drive position sizing.
Copper’s and gas’s risks are high-frequency and survivable. A China scare or a mild winter arrives every few years and costs a large but recoverable fraction of the price: copper halved or worse in 2008 and again into 2016, and Henry Hub’s annual average fell from $6.42 in 2022 to $2.21 in 2024 — a record inflation-adjusted low — before recovering to $3.52 in 2025. These are cyclical drawdowns, not thesis-enders.
Uranium’s dominant risk is the opposite: low-frequency and near-terminal. A serious nuclear accident happens perhaps twice in fifty years, but Fukushima cost the market five years and roughly 55% of the spot price on annual averages, took Cameco down about 75%, and killed an entire cohort of juniors outright. The structural dependence on Russian enrichment (~40% of world capacity) sits in the same quadrant — unlikely to resolve badly, ruinous if it does.
Oil’s and gold’s dominant risks are slow and structural. Peak oil demand, if it arrives, is a decade-long de-rating rather than a crash; a durable return to high positive real rates cost gold years of dead money in 2013–2018 without ever producing a single dramatic day. Slow risks are the easiest to underestimate, because nothing about them ever looks like an emergency.
5. Putting it together: a positioning playbook
The practical payoff is a map from regime to exposure — framed strictly as historical tendencies, not a recommendation. No one knows which regime comes next, and the relationships can break (2022–2025 being the live example). The value is in understanding what each commodity is for.
Table 6. Which commodities have historically favoured each regime
| If the regime is… | Historically favoured | Historically challenged |
|---|---|---|
| Reflation / early-cycle boom | Copper, oil | Gold |
| Late-cycle / high inflation | Oil, gold, gas | — |
| Stagflation / supply shock | Gold, oil | Copper |
| Recession / risk-off | Gold (uranium independent) | Copper, oil |
| Falling real rates / easing | Gold, copper | — |
| Strong dollar / tightening | (defensives) | Oil, copper, gold |
| Regime-agnostic structural bets | Uranium (fuel cycle), copper & gas (electrification / LNG) | — |
Source: synthesised from the individual commodity guides on this blog; historical tendencies, not investment advice.
The playbook says what to hold in a regime; it does not say how, and the how can dominate the outcome. Three vehicles express the same regime call very differently. The commodity itself — physical, or a futures-tracking fund — gives the cleanest exposure but pays a hidden toll when the futures curve is in contango: the largest US natural-gas fund lost more than 90% of its value across the 2010s while Henry Hub merely oscillated sideways, and the largest US oil fund was forced to restructure mid-crisis in April 2020 and never recovered its roll losses even after crude did. Producers add operating leverage in both directions and, with it, jurisdiction, cost-curve position and balance-sheet risk — which is exactly what a screen on production, reserves and cost is for. Diversified majors trade some of that leverage for resilience, as the 2014–16 split between E&Ps and supermajors showed. None of the three is the right answer; the point is that the vehicle choice is a second decision, as consequential as the regime call itself.
The deeper lesson is diversification within the complex. Because gold zigs when copper and oil zag, and because uranium and gas answer to neither the growth cycle nor each other, a basket of these five carries genuinely different exposures rather than one repeated bet on global growth. Gold is the portfolio’s shock absorber; copper and oil are its growth engine; uranium is a structural, cycle-independent theme; and gas is a volatile, weather-driven satellite. Which of those jobs you want — and at what size — is the real positioning question. To go from this big-picture view to the specific companies in each market — every producer screened by production, reserves and cost — explore Metal Pilot .
6. Future outlook & forecasts
The regime matrix above is built from history; the decade ahead is shaped less by the business cycle than by a handful of structural forces that can override it — as electrification did for copper in 2022–2025, when tight money should have hurt it but demand drove records. These are scenarios, not forecasts, but the direction is widely shared.
6.1 The forward macro setup
Two macro variables still anchor everything: the path of real interest rates and the dollar. Falling real rates and a softer dollar would lift the whole complex (gold first, then the cyclicals); a return to high positive real rates with a strong dollar would pressure all five. Layered on top is a more durable backdrop — fiscal dominance and elevated debt, de-dollarisation of reserves, and recurring geopolitical and supply-chain shocks — that broadly favours real assets and the monetary metals. The 2022–2025 stretch is the evidence and the warning at once: gold roughly doubled while nominal rates were high, and copper set records while money was tight, because in both cases a structural buyer — central banks in one market, electrification in the other — outweighed the macro signal the matrix would have read. Expect more of that, not less: the forces below are large enough and slow enough to override a cyclical regime for years at a time, which is why the matrix is a starting point rather than a conclusion. The key habit from this guide still applies: ask what growth is doing and what real rates are doing, then read the matrix — but check it against each commodity’s own structural story below.
6.2 The structural decade across the five
The deeper forward story is demand pulled by electrification and the energy transition, meeting supply that is slow to respond — strongest for copper and uranium, real but price-clearing for the rest. Each commodity guide’s “Future outlook” section covers these in depth; the table synthesises them.
Table 7. The structural outlook to 2050, across the five
| Commodity | Forward demand driver | Supply constraint | Headline forecast (scenario) |
|---|---|---|---|
| Copper | Electrification — grids, EVs, AI data centres | Falling grades, thin project pipeline | IEA STEPS: refined demand ~33 Mt by 2035 and ~37 Mt by 2050; ~30% supply gap (~10 Mt) by 2035 |
| Uranium | Reactor build-out, COP28 tripling pledge, SMRs | Top mines deplete in the 2030s | WNA Reference: requirements ~87,000 tU by 2030 and >150,000 by 2040 (vs ~60,200 tU mined in 2024) |
| Oil | EM transport & petrochemicals vs. EV adoption | Field decline ~4–6%/yr | OPEC: ~123 MMbbl/d by 2050 (no peak); IEA: plateau ~2030 near 105–106 |
| Natural gas | Asia, power, AI data centres, coal-to-gas | No near-term scarcity; LNG-capacity wave | GECF: ~5,300 bcm by 2050; IEA/Shell: LNG surplus from ~2027 |
| Gold | Central-bank reserve diversification | Mine output near a plateau (“peak gold”) | No agency tonnage forecast; central-bank buying >1,000 t/yr in 2022–2024 (1,045 t in 2024) |
Source: synthesised from the individual commodity guides on this blog and from the IEA , WNA , OPEC , GECF , Shell and World Gold Council . Figures are scenario projections, not measured data; the gold and uranium mine-supply figures are measured, from USGS and WNA respectively.
The investment read-through is the one from the playbook, extended forward: copper and uranium are the clearest structural-demand stories (and the tightest supply), gas is a volume-growth-but-well-supplied theme whose risk is a glut, oil is a demand-plateau debate rather than a scarcity story, and gold remains the macro hedge whose bid now includes the official sector. Diversification within the complex still does the real work.
7. Summary
These five commodities are often lumped together as “commodities”, but they are five different macro instruments. Gold is money: it rewards falling real rates, a weak dollar, inflation shocks and crises, and it sits near-uncorrelated with stocks. Copper is the growth metal — high-beta to global and Chinese industry, the first to rally in an expansion and the first to fall in a recession. Oil is both pro-cyclical and the market’s clearest supply-shock and inflation hedge, with the most durable inverse-dollar link of all. Uranium ignores the business cycle entirely, answering to the reactor fleet and the fuel cycle, which makes it a deep-value, deeply volatile diversifier. And natural gas is a weather- and storage-driven regional market, only loosely tied to oil or the macro economy and prone to violent local spikes. Read together — through the regime matrix in Figure 1, the growth–inflation grid in Figure 2 and the correlation matrix in Figure 3 — they form a toolkit: each works in a different weather system, and the diversity is the value. The single most important habit is to ask, of any environment, what is growth doing and what are real rates doing — and then to know which of the five that regime favours.
8. Vocabulary
Table 8. Macro-regime vocabulary
| Term | Plain-language meaning | Why it matters to an investor |
|---|---|---|
| Real interest rate | The nominal interest rate minus expected inflation — the “true” cost of money | Gold’s single most important driver: it pays no yield, so it competes with real rates |
| Nominal interest rate | The stated, headline interest rate, before adjusting for inflation | High nominal rates with high inflation can still mean negative real rates — a gold-friendly mix |
| Pro-cyclical | An asset that rises and falls with the economic cycle (e.g. copper, oil) | Tells you the exposure is a bet on growth, not a hedge against it |
| Safe haven | An asset bought in times of stress, when investors flee risk (e.g. gold) | The only kind of exposure that can rise while a portfolio’s equities fall |
| High-beta | Amplifies the cycle — bigger gains in booms, bigger losses in busts | Commodity equities are typically higher-beta than the commodity itself |
| Operating leverage | Mostly fixed costs, so profits swing more than the selling price | Why miners and E&Ps move 2–3× the underlying commodity in both directions |
| Reflation | Growth and inflation rising together, often after a downturn | The classic backdrop for cyclicals — copper and oil’s best quadrant |
| Stagflation | Weak growth and high inflation at once, usually from a supply shock | The regime where real assets most clearly beat financial assets |
| Disinflation | Inflation slowing from a high level (prices still rising, just more slowly) | Gold’s weakest backdrop; roughly neutral for the cyclicals |
| Deflation | Broadly falling prices with weak demand | Negative for nearly everything cyclical; cash and high-grade bonds win |
| Risk-on / risk-off | Markets favouring (risk-on) or fleeing (risk-off) risky assets | The shorthand for the sentiment swing that drives crisis correlations |
| Diversifier | An asset whose returns are largely uncorrelated with stocks | What actually reduces portfolio risk, as opposed to adding another growth bet |
| Correlation | A −1 to +1 measure of how closely two assets move together | Near-zero is what makes gold useful; correlations converge toward +1 in crises |
| Contango | A futures curve where later months cost more than the front month | A fund that rolls futures forward bleeds value in contango, even if spot goes nowhere |
| Roll cost | The loss (or gain) from selling an expiring future and buying the next one | The reason commodity funds can badly lag the commodity they track |
| Demand destruction | Demand falling because the price itself has risen too far | The mechanism that caps oil rallies and ends commodity spikes |
| Thrifting | Redesigning to use less of a material per unit of output | A slow, structural headwind to long-run demand for any expensive input |
| Resource nationalism | States raising taxes, royalties or control over domestic resources | A recurring supply risk in Chile, Peru, the DRC, Kazakhstan and Indonesia |
| Supercycle | A multi-decade run of above-trend commodity demand and prices | The 2003–2011 China boom is the reference case for copper and oil |
| DXY | The US dollar index, the standard gauge of dollar strength | Every commodity here is dollar-priced, so DXY is the shared cross-asset hinge |
| TIPS | US Treasury Inflation-Protected Securities; their yield is the market real rate | The cleanest daily read on the variable gold trades against |
| Brent | The North Sea benchmark crude, the global oil price reference | The oil price quoted throughout this guide |
| Henry Hub | The Louisiana pipeline hub that sets the US benchmark gas price | The US gas price; TTF (Europe) and JKM (Asia) are the regional equivalents |
| OPEC+ | OPEC plus allied producers, chiefly Russia, coordinating output | The policy lever that can override oil’s macro-regime tendency |
| E&P | Exploration & production company — a pure-play upstream oil or gas producer | The highest-beta way to own oil or gas exposure; majors dampen the swing |
| LNG | Liquefied natural gas — gas chilled to a liquid for seaborne transport | What links otherwise separate regional gas markets, slowly |
| SMR | Small modular reactor — a smaller, factory-built nuclear design | The main source of incremental long-run uranium demand growth |
| ASGM | Artisanal and small-scale gold mining | Gold’s largest ESG exposure: the biggest source of man-made mercury pollution |
| De-dollarisation | Central banks shifting reserves away from US dollar assets | The 2020s bid that has let gold rise despite high nominal rates |
| Fiscal dominance | When government debt levels constrain how tight monetary policy can get | A structural argument for real assets and against high sustained real rates |
Source: standard macro-finance definitions; underlying rate and inflation series from FRED . Commodity-specific terms follow the definitions used in the corresponding commodity guides on this blog.
9. Sources, methodology & disclaimer
9.1 Sources, methodology & data vintage
This guide is a synthesis of the individual commodity guides on this blog — their macro-regime, correlation, price-driver and risk/ESG sections — re-cast on a cross-commodity basis. Underlying price and macro series: LBMA (gold), IMF/LME (copper), UxC/TradeTech (uranium spot), the Energy Institute Statistical Review of World Energy 2025 and U.S. EIA (oil and gas), and FRED for the dollar (DXY), CPI and real-rate (TIPS) data. Annual S&P 500 sector returns are from Novel Investor and gold’s annual returns from the World Gold Council .
Correlations use monthly data over 2000–2024, restated on that single window where a source guide declared none, and are author estimates — rounded, sample-dependent, and explicitly flagged in Table 4 where a cell is not drawn from a commodity guide. Regime “performance” describes historical tendencies from concluded episodes, not measured averages; every qualitative cell in Table 1 is substantiated with a dated episode in Sections 2.1–2.4. Equity magnitudes in Table 3 are the figures stated in the corresponding commodity guides, over concluded windows, and use each guide’s own index or company proxy — so the gold rows quote the HUI gold-miners index rather than an ETF.
Data as of 25 July 2026. The underlying guides carried vintages from 13 June to 24 July 2026 at the time of writing; this aggregate guide is refreshed whenever the underlying commodity guides are updated.
9.2 Disclaimer & disclosure
This report is for informational purposes only and is not investment advice, a recommendation, or an offer to buy or sell any security or commodity. Commodity prices are volatile, and the figures here are estimates as of the stated date that will change; correlations and regime descriptions are historical observations that may not persist and can break down — especially in crises, when correlations converge. Past performance is not indicative of future results. Do your own research and consult a licensed financial adviser before acting. This report was prepared with the assistance of AI; its figures were synthesised from the sources above and reviewed, but readers should verify any number before relying on it. The author holds no position disclosed as a conflict in respect of the assets named.