

Natural Gas — A Complete Market Guide (2026)
Data as of 26 June 2026. Prices are quoted as multi-year and full-year averages, not a single day’s snapshot, so this report stays useful over time. Reserves, production splits, balances, and historical series are estimates from agency data, rounded for clarity. This report is for information only and was prepared with AI assistance — see the disclaimer at the end.
Natural gas is the world’s fastest-growing fossil fuel and the swing fuel of the power grid — it heats homes, fires industry, and increasingly sets the marginal price of electricity. Unlike oil, gas has no single global price: it trades in three semi-separate regional markets, knitted together by a fast-growing fleet of LNG tankers. This report is the free, big-picture primer on how the gas market actually works — where it comes from, how it is priced, who trades it, and which forces drive it. For the company-level data behind the charts — every producer screened by production, reserves and cost — go to Metal Pilot.
TL;DR & Key Takeaways
- What it is: a mixture of mostly methane burned for power, heat and industry, and used as a petrochemical feedstock. It is clean-burning relative to coal but is itself a potent greenhouse gas if it leaks — the heart of its ESG debate.
- Market structure: gas has no single world price. Three regional benchmarks dominate — Henry Hub (US), TTF (Europe) and JKM (Asian LNG) — and the gaps between them are what make LNG trade and US export economics work.
- Who supplies it: the United States (~1,070 bcm, ~26% of world output) leads, followed by Russia, Iran, China and Canada; just five countries pump about 60% of the world’s gas.
- Demand story: consumption (~4,128 bcm in 2024) is led by power generation (~40%), then industry and buildings, and the growth is in Asia and the Middle East while Europe’s demand falls.
- Price regime: gas is weather- and storage-driven and regional, with violent local spikes (Europe 2022) — less a macro-cycle play than oil or copper, and only loosely tied to crude since the US shale boom decoupled Henry Hub.
- Biggest swing factor: the build-out of LNG export capacity linking cheap US gas to premium Asian and European markets, against weather, storage and geopolitics.
Numbers to remember (natural gas at a glance)
Figure 1. Natural gas at a glance
Figure data: Energy Institute Statistical Review of World Energy 2025 and U.S. EIA; see Sections 2.1–2.6.
Why it matters now: gas sits at the centre of the energy-transition debate — a lower-carbon “bridge” from coal that is also a methane risk — while a wave of new LNG export capacity and surging power demand from electrification and AI data centres reshape who buys it and at what price. The big-picture case is below.
How to read this guide: new to natural gas? Read straight through from Section 1. Here for the investment case? Jump to Section 4 — how to own it (and why gas ETFs are a trap), how to screen producers, and what actually drives the price. Every technical term is defined in the Vocabulary (Section 7). Crude oil, gas’s geological sibling, has its own guide .
1. Natural gas & the market basics
1.1 What natural gas is — physical basics & quality
Natural gas is a naturally occurring mixture of hydrocarbon gases, predominantly methane (CH₄), often with ethane, propane and other liquids. Its value comes from a high energy content per unit of carbon and from burning cleanly — it emits roughly half the CO₂ of coal per unit of electricity, with far less particulate pollution, which is why it has displaced coal in power generation across much of the world. It is used for power generation, industrial heat and feedstock, residential and commercial heating, and as the raw material for fertiliser (ammonia) and petrochemicals. Its great weakness is physical: gas is bulky and hard to move, so unlike oil it has historically been a regional commodity, tied to fixed pipelines — a constraint that liquefied natural gas (LNG) is steadily eroding.
A few terms define gas quality and form, each used throughout this report:
- Dry vs. wet gas — “dry” gas is almost pure methane; “wet” gas carries valuable natural gas liquids (NGLs) — ethane, propane, butane — that are stripped out at a processing plant and sold separately.
- Conventional vs. unconventional — conventional gas flows freely from porous reservoirs; unconventional gas (shale/tight gas, coalbed methane) is locked in low-permeability rock and freed by horizontal drilling and hydraulic fracturing — the technology behind the US shale boom.
- Associated vs. non-associated — gas produced alongside oil (associated) versus from a gas-focused field (non-associated). Associated gas is largely inelastic to the gas price because the well’s economics are driven by oil.
- LNG — gas chilled to about −162 °C until it becomes a liquid ~1/600th its gas volume, so it can be shipped by tanker; it is regasified at the destination.
- Sour gas — gas with hydrogen sulphide (H₂S) or CO₂ that must be removed (“sweetened”) before sale.
The value chain — from wellhead to burner tip. Gas moves along one main path: exploration → production (wellhead) → gathering & processing (remove impurities and NGLs) → transport (long-distance pipelines, or liquefaction → LNG shipping → regasification) → storage → distribution → the end user (power, industry, buildings). The decisive, fast-growing link is LNG, which turns regional gas into a globally traded commodity.
Figure 2. The natural gas value chain, wellhead to burner tip
Source: industry value-chain primers; conceptual diagram.
From wellhead to pipeline-quality gas — what “processing” does. Raw gas leaving a well is rarely ready to burn: it carries water, contaminants and heavier hydrocarbons that have to be stripped out first. From the wellhead, gathering lines (small-diameter pipe) collect the raw stream — whether it rises on its own (non-associated gas) or alongside crude oil (associated gas) — and feed it to a processing plant. There the gas is dehydrated (water taken out so it cannot freeze or corrode pipelines), sweetened (the acid gases hydrogen sulfide and carbon dioxide removed), and stripped of its natural gas liquids (NGLs) — the ethane, propane and butane worth more sold separately, which a fractionation unit splits apart. What remains is dry gas: almost pure methane at pipeline specification, ready for the transmission network. To cross an ocean rather than follow a pipe, that dry gas is super-cooled to about −162 °C in a liquefaction train — shrinking it roughly 600-fold into LNG for tanker shipment — and warmed back into gas at a regasification terminal on arrival. Processing is the quiet step that turns a messy wellhead stream into the clean, tradable molecule the rest of the chain assumes.
1.2 Units & measurement conventions
Gas is measured by volume and by energy, and this report states both so every number is unambiguous. By volume, the metric world uses cubic metres, scaling to bcm (billion m³) and Tcm (trillion m³) for national flows and reserves; the US industry uses cubic feet (cf), scaling to Mcf, MMcf, Bcf and Tcf, following the oil-and-gas convention in which M = thousand and MM = million (Roman numerals) — so MMcf is million cubic feet, not thousand. By energy, gas is priced per MMBtu (million British thermal units): Henry Hub is quoted in $/MMBtu. LNG volumes are quoted in million tonnes (Mt). The key conversions: 1 bcm ≈ 35.3 Bcf, 1 Bcf ≈ 1 million MMBtu, 1 Mt of LNG ≈ 1.36 bcm ≈ 48 Bcf, and 1 Bcf/d ≈ 10.3 bcm/yr. Where companies produce oil and gas together, the industry converts at 6,000 cf of gas ≈ 1 barrel of oil equivalent (BOE).
Crucially, gas figures split into flow and stock, and the two must not be confused:
- Flow — quantities per year (or per day): production (~4,100 bcm/yr), consumption (~4,128 bcm/yr), LNG trade (~410 Mt/yr), US gas demand (~90 Bcf/d).
- Stock — a level at a point in time: proved reserves (~188 Tcm), and storage inventories (the gas in underground stores that buffers winter demand and sets the short-term price).
Table 1. Natural gas units and conversions
| Unit | Meaning | Typical magnitude in gas | Conversion |
|---|---|---|---|
| bcm | Billion cubic metres | National/global flows | ≈ 35.3 Bcf |
| Tcm | Trillion cubic metres | Reserves (Russia ~38) | ≈ 35.3 Tcf |
| Mcf / Bcf / Tcf | Thousand / billion / trillion cubic feet | US gas demand ~90 Bcf/d | M = thousand, MM = million |
| MMBtu | Million British thermal units | Henry Hub priced per MMBtu | ≈ 1 Mcf of gas |
| Mt LNG | Million tonnes of LNG | LNG cargoes & trade | ≈ 1.36 bcm ≈ 48 Bcf |
| Bcf/d | Billion cubic feet per day | Pipeline & LNG flows | ≈ 10.3 bcm/yr |
Source: U.S. EIA energy units & calculators and Energy Institute Statistical Review of World Energy 2025 , conversion notes.
Numbers intuition: world production (~4,100 bcm) is about 400 Bcf/d; the United States alone produces ~105 Bcf/d. One large LNG tanker carries ~70,000 tonnes of LNG, roughly 0.1 bcm — about 3.4 Bcf of gas, enough to power a mid-sized city for days. At blended regional prices the global wellhead market is worth on the order of $650 billion a year — but with Henry Hub near $3–4/MMBtu and Asian LNG often three times higher, “the gas price” is always a regional question.
1.3 Pricing & benchmarks
Gas is the most regional of the major commodities, and the rule in this report is to quote averages, not a single day’s snapshot. There is no single world price; instead three hubs dominate. Henry Hub (Louisiana, $/MMBtu) is the US benchmark, kept low and stable by abundant shale gas — it averaged a record-low $2.21/MMBtu in 2024 and $3.52 in 2025. TTF (the Dutch Title Transfer Facility) is Europe’s benchmark, which spiked violently during the 2022 energy crisis. JKM (the Japan-Korea Marker) prices spot LNG into Asia. TTF and JKM have typically run several times Henry Hub, and that spread is exactly what makes LNG arbitrage — and the US export boom — profitable.
Two features set gas pricing apart. First, storage and weather dominate the short term: a cold winter or a hot summer (for power-sector cooling) drains inventories and spikes the price, which is why the weekly EIA storage report moves the US market. Second, much LNG still trades under long-term, oil-indexed contracts, a legacy mechanism that ties some Asian gas prices to crude — though hub-indexed pricing (to Henry Hub or TTF) is steadily taking over.
Table 2. Key natural gas benchmarks
| Benchmark | What it prices | Pricing point | Role |
|---|---|---|---|
| Henry Hub | US pipeline gas | Louisiana ($/MMBtu) | US reference; low & stable (shale) |
| TTF | North-west European gas | Netherlands (virtual hub) | Europe’s benchmark; crisis-prone |
| JKM | Asian spot LNG | Japan/Korea delivered | The Asian LNG marker |
| Oil-indexed LNG | Long-term LNG contracts | Linked to crude | Legacy Asian contract pricing |
Source: U.S. EIA Henry Hub , 2025; ICE TTF and S&P Global Platts JKM , 2025.
The long-run US price story is one of a structural collapse driven by shale. After spiking to $8–9/MMBtu in the mid-2000s (and again in 2008) on fears of scarcity, Henry Hub fell and stayed low once horizontal drilling unlocked vast shale supply — averaging in the $2–4/MMBtu range for most of the 2010s, briefly spiking to $6.42 in 2022 during the global energy crisis, then setting a record inflation-adjusted low of $2.21 in 2024 before recovering to $3.52 in 2025 as LNG exports tightened the market.
Table 3. Average annual Henry Hub price, 2000–2025 (USD/MMBtu)
| Year | 2000 | 2001 | 2002 | 2003 | 2004 | 2005 | 2006 | 2007 | 2008 | 2009 | 2010 | 2011 | 2012 |
|---|---|---|---|---|---|---|---|---|---|---|---|---|---|
| Price | 4.31 | 3.96 | 3.38 | 5.47 | 5.90 | 8.79 | 6.73 | 6.97 | 8.86 | 3.94 | 4.37 | 4.00 | 2.75 |
| Year | 2013 | 2014 | 2015 | 2016 | 2017 | 2018 | 2019 | 2020 | 2021 | 2022 | 2023 | 2024 | 2025 |
|---|---|---|---|---|---|---|---|---|---|---|---|---|---|
| Price | 3.73 | 4.37 | 2.62 | 2.52 | 2.99 | 3.15 | 2.56 | 2.03 | 3.89 | 6.42 | 2.54 | 2.21 | 3.52 |
Source: U.S. EIA Henry Hub natural gas spot price, annual averages , 2000–2025. Figures are calendar-year averages, not spot.
Figure 3. Average annual Henry Hub price, 2000–2025 (USD/MMBtu)
Figure data: Table 3.
2. Supply, demand & the market balance
2.1 Where gas is produced — basins & geology
Gas production has been transformed by unconventional rock. The single biggest change of the century is the US shale revolution: horizontal drilling and hydraulic fracturing of the Marcellus/Utica (Appalachia), Permian and Haynesville plays turned the United States from a gas importer into the world’s largest producer and largest LNG exporter. Elsewhere, supply concentrates in a few giant conventional sources: Russia’s West Siberian fields, Iran and Qatar’s shared North Field/South Pars (the largest gas field on Earth), and the basins of Turkmenistan, Australia and Norway.
In 2024 the United States, Russia, Iran, China and Canada led output and together produced roughly 60% of the world’s gas. The US alone was ~26%. Production is far less cartelised than oil: it is spread across private companies (in North America) and state giants (Gazprom, NIOC, QatarEnergy, PetroChina) elsewhere.
Table 4. Leading natural gas-producing countries, 2024 (bcm)
| Rank | Country | Production (bcm) | Share of world | Trend |
|---|---|---|---|---|
| 1 | United States | 1,069 | 26% | Flat/high (shale) |
| 2 | Russia | 642 | 16% | Recovering |
| 3 | Iran | 279 | 7% | Rising |
| 4 | China | 258 | 6% | Rising |
| 5 | Canada | 199 | 5% | Rising |
| 6 | Qatar | 170 | 4% | Flat (pre-expansion) |
| 7 | Australia | 150 | 4% | Flat |
| 8 | Norway | 117 | 3% | Flat |
| 9 | Saudi Arabia | 114 | 3% | Rising |
| 10 | Algeria | 92 | 2% | Flat |
| — | Rest of world | 1,010 | 25% | — |
| — | World total | ~4,100 | 100% | Rising |
Source: Energy Institute Statistical Review of World Energy 2025 , 2024 data. Figures rounded; shares are approximate.
Figure 4. Leading natural gas-producing countries, 2024 (bcm)
Figure data: Table 4.
At the basin level, a handful of plays and fields carry the market — and the contrast between them is the story of modern gas: rapid-decline shale that must be re-drilled continuously versus giant conventional fields that flow for generations.
Table 5. Major gas basins and fields (approximate 2024 output)
| Basin / field | Country | Type | Output (bcm/yr, ≈) | Note |
|---|---|---|---|---|
| Appalachia (Marcellus + Utica) | United States | Shale | ~360 | Largest gas play on Earth; ~35 Bcf/d |
| Permian (associated gas) | United States | Shale (associated) | ~260 | Grows with oil drilling, price-insensitive |
| West Siberia (Urengoy, Yamburg, Bovanenkovo…) | Russia | Conventional | ~500 | Gazprom’s legacy base, now pivoting east |
| North Field / South Pars | Qatar / Iran | Conventional offshore | ~380 | Largest gas field on Earth, shared |
| Haynesville | United States | Shale | ~150 | LNG-adjacent; higher-cost swing play |
| Montney / WCSB | Canada | Shale / tight | ~180 | Feeds LNG Canada |
| North West Shelf & Gorgon area | Australia | Conventional offshore | ~130 | LNG-dedicated |
| Groningen (closed 2024) | Netherlands | Conventional | ~0 | Europe’s giant, shut for seismicity — a supply-risk case study |
Source: U.S. EIA drilling-productivity and natural-gas data , Energy Institute Statistical Review 2025 and operator disclosures, 2024. Basin-level output approximate and rounded; Russian and Iranian field-level splits are estimates.
2.2 Demand & consumption
Global gas consumption reached a record ~4,128 bcm in 2024, up 2.5% on the year, and the long-run trend is upward as gas displaces coal and powers electrification. By end use, the largest single call on gas is power generation (~40%), where gas-fired plants provide flexible, dispatchable electricity and increasingly set the marginal power price; industry (~25%) uses gas for heat and as feedstock (fertiliser, petrochemicals); buildings (~21%) burn it for heating and cooking; and the energy sector’s own use, plus losses (~14%), makes up the rest.
Table 6. Global natural gas demand by end use, 2024 (approx. share)
| End use | Share | Note |
|---|---|---|
| Power generation | 40% | Flexible electricity; sets marginal power price |
| Industry | 25% | Heat + feedstock (fertiliser, petrochemicals) |
| Buildings (residential & commercial) | 21% | Heating and cooking |
| Energy own-use & other | 14% | Processing, pipelines, losses |
Source: IEA gas market analysis and Energy Institute , 2024; shares approximate.
Figure 5. Global natural gas demand by end use, 2024
Figure data: Table 6.
Geographically, demand growth has shifted decisively toward Asia and the Middle East. North America remains the largest consuming region (cheap shale gas), and the Eurasian (CIS) region is steady, but Europe’s demand has fallen — accelerated by the loss of Russian pipeline gas after 2022 — while Asia Pacific (led by China) and the Middle East have grown rapidly. The result is a market whose centre of gravity is moving east, pulled by LNG.
Table 7. Natural gas consumption by region, selected years (bcm)
| Region | 2000 | 2010 | 2020 | 2024 |
|---|---|---|---|---|
| North America | 770 | 840 | 1,010 | 1,080 |
| Asia Pacific | 330 | 600 | 870 | 960 |
| CIS / Eurasia | 520 | 600 | 600 | 620 |
| Middle East & other | 290 | 600 | 900 | 990 |
| Europe | 500 | 560 | 540 | 480 |
| Total consumption | ~2,410 | ~3,200 | ~3,920 | ~4,130 |
Source: Energy Institute Statistical Review of World Energy , consumption series; regional splits are approximate. “Middle East & other” aggregates the Middle East with Africa and South & Central America, whose individual gas shares are small — the remaining rows follow the standard EI grouping.
Figure 6. Natural gas consumption by region, 2000–2024 (bcm)
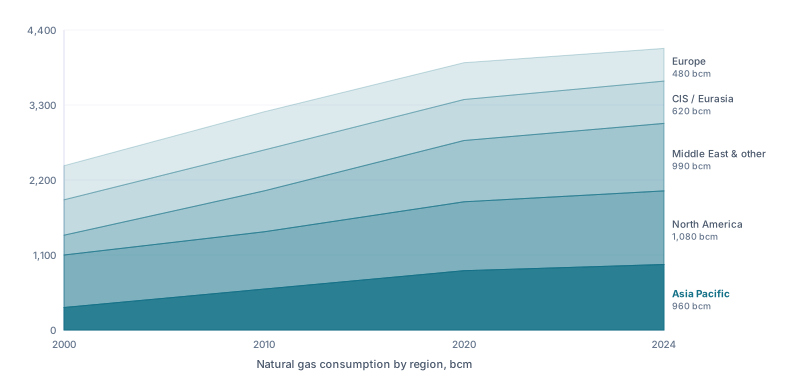
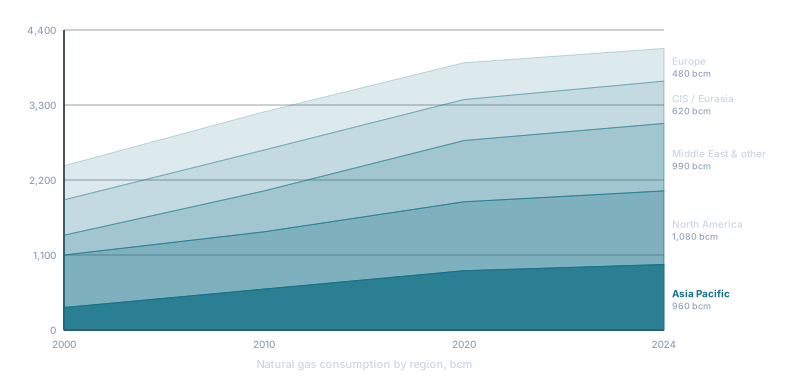
Figure data: Table 7.
2.3 Supply: producing countries
World gas production has risen by roughly 70% since 2000, from ~2,400 bcm to ~4,100 bcm, driven first by the US shale boom and then by LNG-fed expansions in the Middle East, Australia and Russia. Output dipped in 2020 (the pandemic) and 2022–23 (the loss of Russian flows to Europe) but reached a fresh record by 2024.
Table 8. World natural gas production, selected years (bcm)
| Year | 2000 | 2005 | 2010 | 2015 | 2020 | 2022 | 2023 | 2024 |
|---|---|---|---|---|---|---|---|---|
| Production | 2,410 | 2,800 | 3,200 | 3,540 | 3,850 | 4,050 | 4,060 | 4,100 |
Source: Energy Institute Statistical Review of World Energy , production series, 2000–2024. Figures rounded.
Reserves tell the longevity story, and here the ranking is dominated by three states: Russia, Iran and Qatar together hold over half of the world’s ~188 Tcm of proved reserves. At ~4,100 bcm of annual production, that base implies a global reserve life (R/P) of roughly 46 years — though, as with oil, reserves are an economic estimate that grows with price and technology.
Table 9. Top natural gas reserves by country, 2024 (Tcm, proved)
| Country | Reserves (Tcm) | Country | Reserves (Tcm) |
|---|---|---|---|
| Russia | 38.3 | China | 8.4 |
| Iran | 32.6 | Venezuela | 6.3 |
| Qatar | 24.7 | Saudi Arabia | 6.0 |
| Turkmenistan | 13.6 | UAE | 5.9 |
| United States | 12.6 | Nigeria | 5.7 |
| World total | ~188 |
Source: Energy Institute Statistical Review of World Energy / historical BP series, proved reserves. Figures approximate.
Figure 7. World natural gas production, 2000–2024 (bcm)
Figure data: Table 8.
2.4 The supply–demand balance
Gas is a genuinely consumed commodity, so its balance behaves like oil’s: when production exceeds consumption, storage builds and prices fall; when demand outruns supply, inventories draw down and prices spike. Because gas is hard to move, each region clears its own balance — a glut in the US (cheap Henry Hub) can coexist with scarcity in Europe (expensive TTF), and only LNG arbitrages the difference. The market’s swing buffer is underground storage, refilled in summer and drawn in winter; an unusually cold winter or a supply shock (such as the 2022 loss of Russian pipeline gas to Europe) can empty storage and send regional prices to extremes.
At the country level, a few net exporters — the United States (now a major LNG exporter), Russia, Qatar and Norway — supply the large net importers of East Asia and Europe (China, Japan, South Korea, Germany), which produce little relative to what they burn. This export-to-Asia-and-Europe pull is what the LNG build-out is racing to serve. The multi-year demand and supply outlook is detailed in Section 5.
Table 10. Natural gas net positions, major countries, 2024 (bcm)
| Country | Production | Consumption | Net position |
|---|---|---|---|
| United States | 1,069 | ~900 | +169 (net exporter) |
| Russia | 642 | ~480 | +162 (net exporter) |
| Qatar | 170 | ~40 | +130 (net exporter) |
| Norway | 117 | ~4 | +113 (net exporter) |
| Japan | ~2 | ~95 | −93 (net importer) |
| China | 258 | ~430 | −172 (net importer) |
Source: production and consumption from Energy Institute Statistical Review of World Energy , 2024. Figures approximate; the gap is met by pipeline and LNG trade.
Figure 8. Natural gas net positions, major countries, 2024 (bcm)
Figure data: Table 10.
2.5 Supply structure: conventional, unconventional & how gas moves
Two structural features define modern gas supply. First, the rise of unconventional production: shale and tight gas now dominate US output and are the reason world gas grew so fast, while much of the rest of the world still relies on conventional fields and on associated gas produced alongside oil (which is largely inelastic to the gas price — its economics live in the oil guide ). Second, and the swing factor for the global market, is how gas crosses borders. Most gas is still moved by pipeline, but LNG has grown from a niche to roughly half of internationally traded gas — and essentially all of the flexible, spot-traded portion. LNG is what lets cheap US gas reach premium Asian and European buyers, and it is the fastest-growing part of the supply chain.
LNG’s share of traded gas has climbed steadily as liquefaction capacity has been built out in the US, Qatar and Australia. Pipelines remain cheaper over land and short distances, but they are rigid and politically exposed — the 2022 severing of Russian pipeline flows to Europe, replaced largely by seaborne LNG, showed both the vulnerability of pipelines and the flexibility of LNG.
Table 11. International gas trade — pipeline vs. LNG (share of traded gas)
| Year | Pipeline | LNG | Note |
|---|---|---|---|
| 2010 | 68% | 32% | LNG still a minority |
| 2020 | 55% | 45% | LNG rising fast |
| 2024 | ~50% | ~50% | LNG now ~half of trade |
Source: Energy Institute Statistical Review of World Energy and U.S. EIA , gas-trade series; shares approximate.
Figure 9. International gas trade — pipeline vs. LNG, 2010–2024 (% of trade)
Figure data: Table 11.
2.6 Trade flows: pipelines & LNG
Gas trade runs along two very different networks. Pipelines carry gas overland on fixed routes — Russia to Europe and China, Norway to Europe, the US-Canada-Mexico grid, Central Asia to China — and are cheap but inflexible and politically exposed. LNG moves by tanker on flexible, seaborne routes, and is rewriting the map: the United States has become the world’s largest LNG exporter, alongside Australia and Qatar, shipping to the great import hubs of China, Japan, South Korea and, increasingly, Europe (which pivoted hard to LNG after losing Russian pipeline gas). The chokepoints are LNG-specific — liquefaction and regasification terminals, and shipping lanes such as the Strait of Malacca and the Panama and Suez canals — rather than a single artery like oil’s Strait of Hormuz (though Qatari LNG does transit Hormuz).
Table 12. Major natural gas trade roles, 2024
| Player | Role | Position |
|---|---|---|
| United States | Largest LNG exporter; pipeline to Mexico | Net exporter |
| Russia | Largest pipeline exporter (now eastward) | Net exporter |
| Qatar / Australia | Top LNG exporters | Net exporters |
| China | Largest LNG importer; also pipeline imports | Net importer |
| Japan / South Korea | Major LNG importers | Net importers |
| Europe | Pivoted from Russian pipeline to LNG | Net importer |
Source: U.S. EIA — LNG trade , Energy Institute and UN Comtrade , 2024.
Figure 10. Global natural gas trade flows
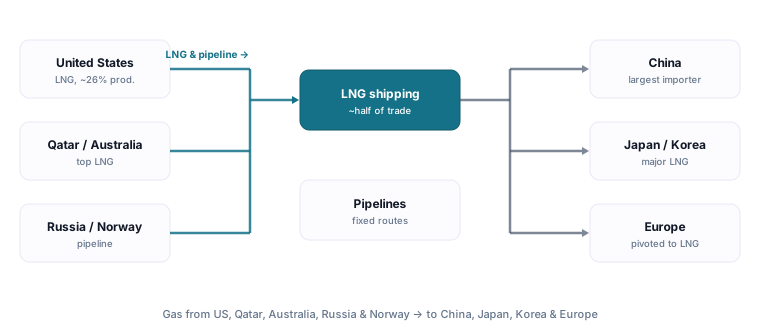
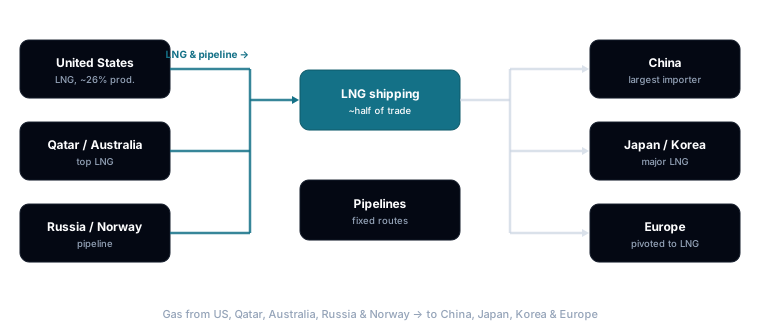
Source: U.S. EIA, Energy Institute and UN Comtrade, 2024; see Table 12.
Because LNG is seaborne, gas trade has inherited a set of maritime chokepoints — narrower in impact than oil’s, but real. The one that matters most is the Strait of Hormuz: essentially all of Qatar’s LNG — roughly a fifth of global LNG supply — must transit it, with no bypass. The Red Sea pair (Suez, Bab el-Mandeb) and the Panama Canal shape routing costs rather than survival: when Red Sea attacks (2024) and Panama drought restrictions (2023–24) hit simultaneously, cargoes simply took longer routes and freight rates absorbed the shock — a concluded demonstration that LNG routing is flexible where pipeline routing is not.
Table 13. LNG chokepoints and exposure (2024 baseline)
| Chokepoint | What transits | Share of global LNG (≈) | Workaround |
|---|---|---|---|
| Strait of Hormuz | All Qatari + UAE LNG | ~20% | None — the systemic LNG risk |
| Strait of Malacca | Middle East → North Asia cargoes | ~25% touches it | Sunda/Lombok (longer) |
| Panama Canal | US Gulf → Asia (shortest route) | ~5–10% (varies) | Cape / Suez routing (+10–15 days) |
| Suez Canal / Bab el-Mandeb | Atlantic ↔ Asia arbitrage cargoes | ~5–10% (varies) | Cape of Good Hope |
Source: U.S. EIA LNG trade data and route analyses, 2024; shares approximate — LNG routing shifts with arbitrage, so exposure is a range, not a constant. Hormuz is the exception: Qatari volumes have no alternative route.
Figure 11. Largest LNG exporters, 2024 (Mt)
Source: U.S. EIA — the US remained the world’s largest LNG exporter in 2024 , 2024; volumes approximate.
2.7 Market organisations & coordination
Gas has no effective cartel. The closest body is the Gas Exporting Countries Forum (GECF), founded in 2001 and headquartered in Doha, whose members — including Russia, Iran, Qatar, Algeria, Nigeria, Egypt, the UAE, Venezuela, Bolivia, Trinidad & Tobago, Libya and Equatorial Guinea — control roughly 70% of proved reserves, about 40% of marketed production and half of pipeline and LNG exports. But unlike OPEC, the GECF sets no production quotas: gas markets are too regional and contract-bound, and the largest producer (the United States) is a private-sector market, not a member. Coordination, where it exists, is really state power — Russia’s historic leverage over European pipeline supply, and Qatar’s swing role in LNG — rather than a formal cartel.
The bodies that genuinely shape the market are statistical and regulatory: the IEA publishes the authoritative gas-market outlooks; the Energy Institute (formerly BP) publishes the Statistical Review; the US EIA publishes the data and weekly storage reports that move the US price; and exchanges (ICE, CME) run the Henry Hub, TTF and JKM-linked futures. Government policy — LNG export licensing, methane regulation, the EU’s diversification drive — is now a primary force.
Table 14. Natural gas market bodies and where the leverage sits
| Body / actor | Role | Leverage |
|---|---|---|
| GECF | Forum of gas exporters | ~70% of reserves; no quotas |
| Russia (Gazprom) | Largest pipeline exporter | Historic European supply leverage |
| Qatar (QatarEnergy) | Top LNG exporter | Swing LNG capacity (North Field) |
| IEA / EIA / Energy Institute | Data & outlooks | Storage reports, market analysis |
| ICE / CME | Exchanges | Henry Hub / TTF / JKM futures |
Source: GECF , IEA , U.S. EIA and Energy Institute , 2025.
2.8 Gas storage & strategic reserves
Gas has no true equivalent of oil’s strategic petroleum reserve. Because it is bulky and costly to store, its strategic buffer is working gas held in underground storage — depleted reservoirs, aquifers and salt caverns filled in summer and drawn in winter — backed increasingly by government fill mandates rather than dedicated national stockpiles. Storage is the mechanism that clears every seasonal balance, so its level is the single most-watched number in the gas market.
How big is the buffer? US working gas in storage peaks near ~3,800–4,000 Bcf ahead of winter — against winter demand that can top 100 Bcf/d, that is only about 40 days of peak-season consumption, which is why a few cold weeks can flip the market. Europe’s storage capacity is ~100 bcm, roughly a fifth of annual demand; after inventories nearly ran dry in 2022, the EU now mandates that storage reach ~90% of capacity by 1 November each year — a policy buffer that functions as Europe’s strategic reserve. China is building storage aggressively toward energy-security targets, while Japan and South Korea lean on commercial LNG inventories rather than a formal reserve. The market’s highest-frequency signal, the EIA weekly storage report, is read against the five-year average band: storage below the band is bullish, above it bearish, almost mechanically.
Figure 12. US working gas in storage vs. the five-year band
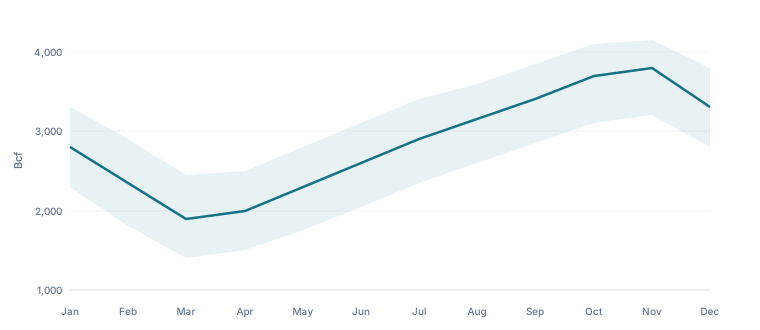
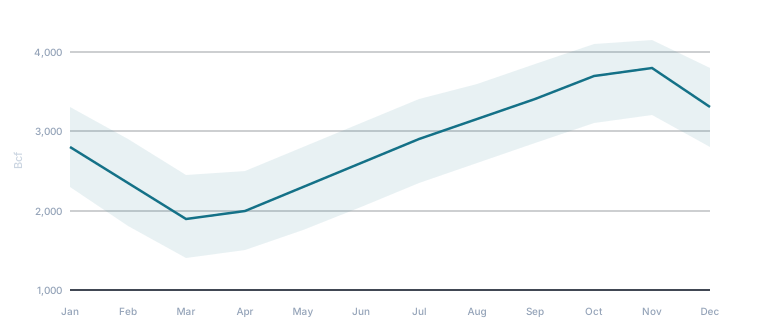
Source: U.S. EIA Weekly Natural Gas Storage Report , working-gas series and five-year range; EU gas storage regulation ; seasonal pattern, levels approximate.
3. The companies & the value chain
3.1 The largest gas companies
Gas production splits into three corporate worlds, and in an evergreen guide the way to size them up is by durable fundamentals — production and reserves — not market capitalisation or share price, which move daily and date a report instantly. The state giants dominate the reserve rankings: Russia’s Gazprom is the world’s largest gas producer with vast reserves, while QatarEnergy (the top LNG producer, expanding the North Field) and China’s PetroChina/CNPC sit on huge state-controlled bases. The integrated majors — ExxonMobil, Shell, TotalEnergies, Chevron — produce large volumes and dominate the global LNG trading business, but book comparatively small reserves. And the US pure-plays — Expand Energy (formed by the 2024 Chesapeake–Southwestern merger, now the largest US gas producer) and EQT — are the listed names most levered to the Henry Hub price.
Table 15. Leading natural gas producers by output and reserves, 2024
| Company | Country | Type | Listing | Gas output (bcm) | Reserves (approx.) |
|---|---|---|---|---|---|
| Gazprom | Russia | State | Public (MOEX: GAZP); state majority, sanctioned | ~416 | ~27.8 Tcm |
| QatarEnergy | Qatar | State | State-owned (unlisted) | ~170 | very large (North Field) |
| PetroChina / CNPC | China | State | Public (SSE: 601857; HKEX: 857); state parent CNPC | ~140 | large |
| ExxonMobil | United States | Major | Public (NYSE: XOM) | ~95 | modest (booked) |
| Shell | UK | Major | Public (LSE: SHEL; NYSE ADR) | ~90 | modest (booked) |
| TotalEnergies | France | Major | Public (Euronext: TTE; NYSE ADR) | ~78 | modest (booked) |
| Expand Energy | United States | Pure-play | Public (NASDAQ: EXE) | ~72 | shale (Appalachia + Haynesville) |
| EQT | United States | Pure-play | Public (NYSE: EQT) | ~62 | shale (Appalachia) |
Source: company annual reports and the Energy Institute Statistical Review , 2024; output is marketed gas and reserves are as reported on differing bases (state NOCs book far larger reserves than the majors). Listing gives the primary exchange and state/controlling shareholders — Gazprom trades on MOEX but is effectively inaccessible to most Western investors under sanctions. No market-capitalisation figures are shown by design.
Figure 13. Leading natural gas producers — output vs. reserves, 2024
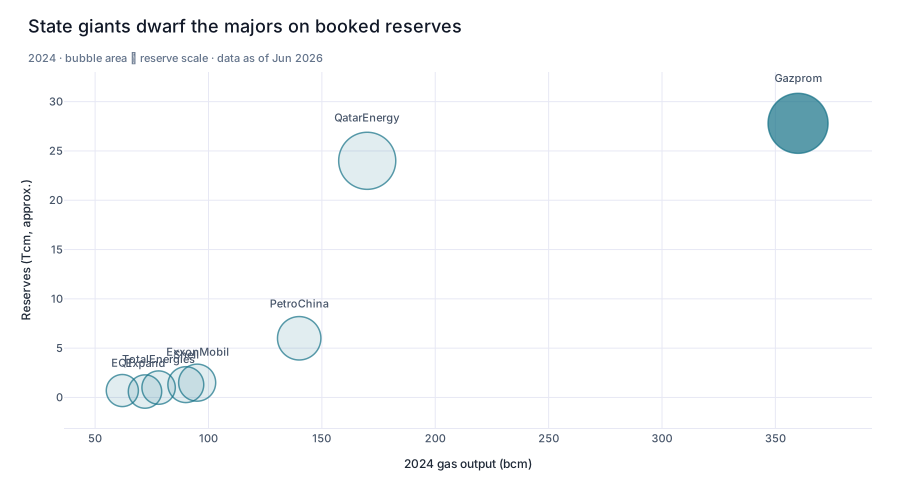
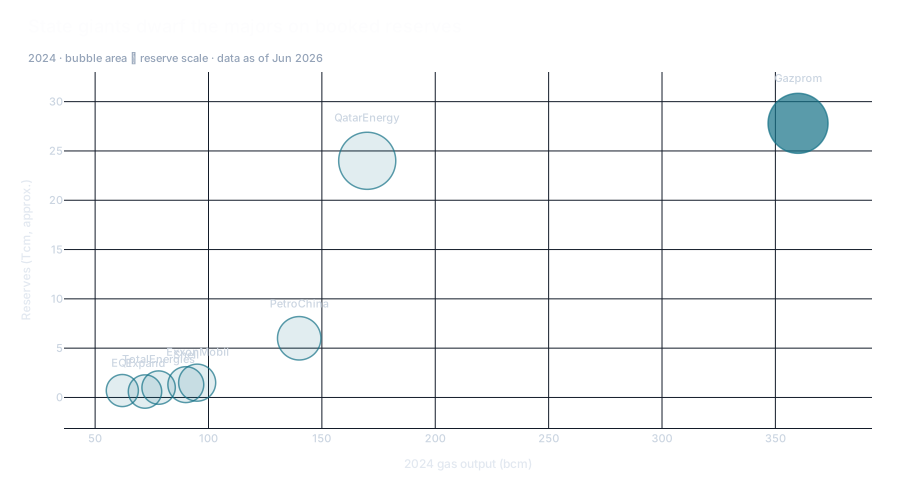
Figure data: Table 15.
3.2 Company archetypes along the value chain
Gas exposure spans a wide risk/return spectrum, and an investor should match the archetype to the goal. Explorers and developers carry the most price and execution risk. Upstream pure-plays (Expand Energy, EQT) mine and sell gas with direct, leveraged exposure to Henry Hub — the highest-beta way to play the commodity. Integrated majors blend gas with oil, refining and trading, dampening gas leverage but adding stability and a global LNG business. Midstream and LNG companies (pipelines, processors, liquefaction terminals) earn fee-based, take-or-pay income that is largely insulated from the gas price — the lower-risk way to own the theme. Utilities and marketers sit at the demand end, often hedged. State NOCs (Gazprom, QatarEnergy) carry political as much as price risk.
Table 16. Natural gas company archetypes
| Archetype | What they do | Revenue model | Price sensitivity |
|---|---|---|---|
| Explorer / developer | Find & build gas projects | None until production | Very high |
| Upstream pure-play | Produce & sell gas | Gas sales − cost | High (operating leverage) |
| Integrated major | Gas + oil + LNG trading | Diversified | Medium (blended) |
| Midstream / LNG | Pipelines, processing, liquefaction | Fee / take-or-pay | Low (fee-based) |
| Utility / marketer | Distribute & sell to end users | Regulated / margin | Low–medium |
| State NOC | National gas champion | State-directed | Medium (+ political) |
Source: company filings; the Metal Pilot project-type taxonomy, 2025.
Figure 14. Natural gas company archetypes by price sensitivity
Source: company filings; conceptual, see Table 16.
3.3 Infrastructure & balance-sheet assets
What a gas company owns — and how those assets are measured — determines what its filings are telling you. An upstream producer’s balance sheet is built on its proved reserves (in Tcf or bcm, valued via the net present value of the development plan) and its acreage and wells (measured by production rate in Bcf/d and decline rate). Midstream and LNG companies own very different assets: pipelines, processing plants, storage and liquefaction terminals, valued by capacity, utilisation and the length and credit quality of their contracts (take-or-pay deals underpin LNG project financing). As with oil, watch gross vs. net — joint-venture stakes (especially in LNG trains) mean the attributable share is what reaches shareholders.
Table 17. Natural gas-company asset types and metrics
| Asset type | What it does | Key metric | Unit |
|---|---|---|---|
| Proved reserves | The in-ground gas base | Reserves; R/P life | Tcf / bcm; years |
| Acreage & wells | Produce gas | Output; decline rate | Bcf/d; %/yr |
| Processing plants | Strip NGLs & impurities | Capacity; utilisation | Bcf/d; % |
| Pipelines & storage | Move & buffer gas | Capacity; throughput | Bcf/d; Bcf |
| LNG terminals | Liquefy / regasify | Capacity; contract cover | Mtpa; years |
Source: company reserve statements (SEC / NI 51-101) and annual reports, 2024; Metal Pilot project data.
4. Investing in natural gas
4.1 Ways to own it — exposure vehicles
Gas punishes the wrong vehicle more brutally than any other commodity, so this decision comes first. You cannot hold the commodity — and, uniquely, you should be deeply sceptical of the products that claim to hold it for you. Futures (Henry Hub, TTF) are the direct instrument: leveraged, margined, and rolled monthly — a professional’s tool in the most volatile major commodity market. Futures-based ETFs wrap that roll for retail buyers, and here the roll-yield trap is at its most severe: gas’s steep, persistent contango (storage is expensive, supply is abundant) means the fund sells cheap and buys dear month after month. The concluded record is brutal — over the 2010s the largest US gas ETF lost more than 90% of its value while Henry Hub itself merely oscillated sideways; the roll, not the price, did the damage. A gas ETF is a short-term trading instrument, full stop. For any longer horizon, the vehicle is equities: pure-play producers (the highest-beta expression — with their hedge books determining how much of a rally they actually capture), integrated majors (gas diluted by oil and refining), midstream/LNG owners (fee-based, take-or-pay income largely insulated from the gas price — the income route), and utilities at the regulated end.
Table 18. Ways to own natural gas
| Vehicle | What you actually own | Tracks spot? | Key structural cost / risk | Best suited for |
|---|---|---|---|---|
| Futures (Henry Hub / TTF) | Exchange contracts | Yes, near-term | Extreme volatility, leverage, roll | Professionals, hedgers |
| Futures-based ETF | A rolled futures position | No — severe decay | Steep contango roll drag (see above) | Days-to-weeks tactical views only |
| Pure-play producer equities | Shale gas businesses | Loosely — via hedge book | Hedges cap rallies; high cost of a glut | Leverage to the price |
| Integrated majors | Diversified energy businesses | Weakly | Gas is a minority of earnings | Core energy exposure |
| Midstream / LNG equities | Fee-based infrastructure | Barely | Contract/counterparty risk, not price | Income |
| Utilities | Regulated distribution | No | Rate regulation, not commodity | Defensive income |
Source: vehicle structures per exchange contract specifications (CME/ICE) and issuer product documentation; structural attributes only — no fees or prices, which change.
4.2 How to value & screen gas producers
The facts above turn into a repeatable checklist. For an upstream producer, the metrics that matter are the reserve base and reserve life (R/P), the breakeven price per MMBtu (who keeps drilling when Henry Hub falls — a low-cost Appalachian or Permian-associated producer survives a downturn that sinks a high-cost driller), the decline rate (shale wells deplete fast and must be continuously re-drilled), and the hedge book (how much output is sold forward, which protects cash flow but caps upside in a rally). For midstream and LNG names, it is the opposite: contract cover, counterparty credit and capacity utilisation matter more than the spot price, because their cash flows are fee-based. For explorers and developers, it is resource size, cost and the path to first gas.
The single most useful tool is the cost curve: rank world (or basin) production from cheapest to most expensive breakeven, draw the prevailing price across it, and you can see who earns a margin and who is underwater — the screen (reserves, breakeven, decline, hedges) you can run across every gas producer on Metal Pilot.
Table 19. Natural gas-producer screening metrics
| Metric | What it tells you | Good vs. concerning | Where to find it |
|---|---|---|---|
| Reserves / R/P life | Scale and longevity | Larger, longer is better | Reserve statement |
| Breakeven ($/MMBtu) | Cost competitiveness | Bottom-half of curve healthy | Investor presentation |
| Decline rate | Re-drilling treadmill | Lower is better (long-life) | MD&A / type curves |
| Hedge book | Cash-flow protection | Some upside left uncapped | Hedging disclosure |
| Basis differential | Local price vs. Henry Hub | Tight to the hub is better | Regional pricing notes |
Source: company MD&A and reserve statements, 2024; cost-curve concept per the Metal Pilot model reference.
Figure 15. Illustrative natural gas cost curve (breakeven vs. cumulative output)
Chart source: illustrative; breakeven ranges from company disclosures, 2024, price line from Table 3. Stylised, not company-level data.
4.3 Macro regimes, rates & correlations
Gas’s behaviour is the most weather- and storage-driven of any commodity here, and the least tied to the macro cycle. Because demand is dominated by power generation and heating, the dominant drivers are temperature, storage levels and regional supply shocks, not GDP growth or interest rates. This makes gas a volatile, seasonal, regional market prone to violent local spikes (Europe 2022) and gluts (US 2024) that can occur with little reference to the broader economy. (For how the major commodities compare across macro regimes — a comparison gas largely sits outside — see the macro regime guide .)
The practical implication is idiosyncratic correlations. US gas is most tightly linked to US power prices (gas sets the marginal cost of electricity), and moderately to coal (the two compete in power) and to European/Asian gas (LNG arbitrage). Its link to crude oil has weakened sharply since the shale boom decoupled Henry Hub from oil — though oil-indexed LNG contracts keep a residual tie. Its correlation to broad equities is low. These relationships shift with the seasons and break down around shocks.
Table 20. Natural gas across economic & seasonal regimes
| Regime | Typical gas behaviour | Why | Example |
|---|---|---|---|
| Cold winter / hot summer | Strong (spikes) | Heating & power-cooling draw storage | Winter 2021; US summers |
| Mild weather / high storage | Weak (gluts) | Oversupply, full storage | US 2024 record low |
| Regional supply shock | Very strong (local) | Pipeline loss, outages | Europe 2022 crisis |
| Coal cheap vs. gas | Weak | Power switches to coal | 2015–2016 |
| LNG capacity wave | Tighter (US) / looser (importers) | Exports drain US supply | 2022–2025 US |
| Broad recession | Largely independent | Demand is weather/power-led | 2020 (brief) |
Source: long-run Henry Hub series and seasonal storage data; author analysis. Regime descriptions are historical, not predictive.
On past performance, gas is a study in volatility: Henry Hub has swung from ~$2 to ~$13 intraday over the past two decades, with the 2000s scarcity highs, the shale-driven 2010s lows, the 2022 crisis spike and the 2024 record low — far sharper, more frequent reversals than oil. The European TTF’s 2022 move (to the equivalent of ~$90/MMBtu at its peak) was one of the most extreme commodity spikes ever recorded. Gas rewards traders who read weather and storage, and punishes buy-and-hold. Past performance is not indicative of future results.
The equity amplifier — and destroyer. Gas equities don’t just amplify the commodity; in the wrong part of the cost curve they don’t survive it. The concluded case is the 2014–2020 shale-gas bear: with Henry Hub pinned near $2–3/MMBtu for years, Chesapeake Energy — a decade earlier the second-largest US gas producer — filed for Chapter 11 in June 2020, while low-cost Appalachian operators lived to see the other side. That other side came fast: from the 2020 trough to the 2022 spike, Henry Hub roughly tripled on an annual-average basis ($2.03 → $6.42) and EQT, the largest pure-play, rose roughly five-fold from its 2020 lows — before hedge books and the 2023–24 glut clawed much of it back. The lesson is double-edged: cost position decides who survives the gluts, and the hedge book decides how much of the spike a producer actually captures. (Data: EIA Henry Hub series; company filings and price histories, 2014–2022 — concluded episodes.)
On correlations (monthly data, 2000–2024), US gas shows a high relationship with US wholesale electricity (≈ +0.7, since gas sets the marginal power price), a moderate link to coal (≈ +0.4) and European gas/TTF (≈ +0.4, via LNG), a modest link to crude oil (≈ +0.3, weakened post-shale), and a low correlation with broad equities (≈ +0.1). These are seasonal and unstable around shocks.
Table 21. Natural gas (Henry Hub) correlations (monthly, 2000–2024)
| Asset | Correlation with gas | Note |
|---|---|---|
| US wholesale electricity | ≈ +0.7 (high) | Gas sets the marginal power price |
| Coal | ≈ +0.4 (moderate) | Compete in power generation |
| European gas (TTF) | ≈ +0.4 (moderate) | Linked by LNG arbitrage |
| Crude oil (Brent) | ≈ +0.3 (modest) | Decoupled since the shale boom |
| S&P 500 | ≈ +0.1 (low) | Largely weather/storage-driven |
Source: author analysis of EIA Henry Hub, power and fuel series, monthly, 2000–2024. Correlations are time-varying and can break down around shocks.
Figure 16. Natural gas correlations, monthly 2000–2024
Figure data: Table 21.
4.4 Price drivers & cycles
Stripping out the noise, the gas price is driven by a short list of forces — and the clearest evidence comes from concluded historical episodes, not live events. On the demand side: weather (heating and cooling), coal-to-gas switching in power, industrial activity, and LNG export pull. On the supply side: shale productivity, storage levels, pipeline and infrastructure outages, and geopolitics. The recurring pattern is short, sharp, regional cycles set by storage and weather rather than the long capex cycles of oil and metals.
The settled case studies that illustrate the drivers: the mid-2000s scarcity scare drove US prices toward $9–13/MMBtu before the shale revolution (2008 onward) crushed them and kept Henry Hub low for a decade; the 2020 pandemic pushed US gas to a multi-decade low near $1.6/MMBtu intraday; the 2022 European energy crisis, after Russia cut pipeline flows, sent TTF to the equivalent of ~$90/MMBtu and rewired global LNG flows; and the 2024 US glut — warm weather, full storage and booming production — produced the lowest annual Henry Hub price on record before LNG exports tightened the market in 2025. Each is resolved history; the durable lesson is that gas spikes when weather or a supply shock empties storage faster than supply can respond, and collapses when mild weather and abundant shale leave storage full.
Table 22. Natural gas price drivers
| Driver | Direction of effect | Why | What to watch |
|---|---|---|---|
| Weather | Cold/hot → higher gas | Heating & power-cooling demand | Forecasts, HDD/CDD |
| Storage | Low storage → higher gas | The market’s buffer | EIA weekly storage report |
| LNG exports | More exports → higher US gas | Drains domestic supply | New terminal start-ups |
| Coal-to-gas switching | Switching → higher gas | Power-sector swing demand | Coal vs. gas spread |
| Shale productivity | More supply → lower gas | The structural supply force | Rig count, well productivity |
| Geopolitics | Supply shock → higher gas | Pipeline/route disruption | Russia, Middle East |
Source: agency outlooks (U.S. EIA , IEA ) and long-run price history. Case studies are concluded historical episodes.
Stripped to a forward frame, the same forces resolve into three illustrative regimes — conditions, not forecasts.
Table 23. Illustrative natural gas price scenarios
| Scenario | Conditions | Likely regime |
|---|---|---|
| Bear | Mild winters, full storage, LNG capacity glut outrunning demand | Henry Hub grinds toward the ~$2 shale-cost floor; high-cost drillers idle |
| Base | Normal weather, storage near the five-year average, LNG build roughly matched to demand | Henry Hub around $3–4; TTF and JKM a multiple higher on LNG pull |
| Bull | Cold winter or supply shock draining storage, or LNG demand outrunning capacity | Sharp regional spikes (Europe 2022–style); price finds the demand-destruction ceiling |
Source: illustrative scenario conditions drawn from the 2000–2025 record; explicitly not predictions.
4.5 Risks, controversies & ESG
The bull case has real counterweights. The dominant financial risk is price volatility itself: gas is the most volatile major commodity, and a mild winter plus full storage can halve the price (as 2024 showed), wiping out high-cost producers. Geopolitical and infrastructure risk is acute — the 2022 severing of Russian pipeline gas to Europe is the defining recent example — and LNG overbuild is a live concern, as a wave of new export capacity could outrun demand and compress margins. Substitution is structural: renewables plus storage increasingly compete with gas in power generation, even as gas competes with coal.
On the non-financial side, gas carries a distinctive ESG profile. Burned, it is cleaner than coal — its core climate selling point as a “bridge fuel”. But methane leakage across the value chain is a potent near-term greenhouse-gas risk that can erode that advantage, and is now the focus of tightening regulation and satellite monitoring. Hydraulic fracturing raises water-use, induced-seismicity and local-pollution concerns, and large LNG and pipeline projects face permitting and community opposition. Whether gas is a genuine bridge to a low-carbon system or a lock-in of fossil infrastructure is one of the most contested questions in energy — and reasonable analysts weigh it very differently.
Figure 17. Natural gas risk map — likelihood vs. impact
Source: author’s qualitative assessment; see Section 4.5.
5. Future outlook & forecasts
Gas sits between the fossil fuels that face decline and the metals that face a boom: most forecasters see demand still growing for decades, driven by Asia, power generation and LNG, even as Europe shrinks. As always these are scenarios, not measured facts — and gas’s central tension is not scarcity but the wave of new LNG capacity now arriving.
5.1 Demand
The Gas Exporting Countries Forum (GECF), in its Global Gas Outlook 2050, projects global demand rising about 32% — from ~4,000 bcm to ~5,300 bcm by 2050 — with Asia Pacific supplying ~53% of the net growth and power generation the single largest driver; European demand, by contrast, falls from ~460 bcm to 310 bcm. The IEA’s nearer-term Gas 2025 sees demand growing about **1.5% a year to 2030 (+380 bcm)**, though its longer-run policy scenarios flatten demand earlier as renewables displace gas in power. The divergence is the familiar one: gas-industry bodies see a multi-decade growth runway; energy-transition scenarios see an earlier plateau. The swing factors are LNG, Asian coal-to-gas switching, AI data-centre power demand, and the pace of renewables.
5.2 Supply and the LNG wave
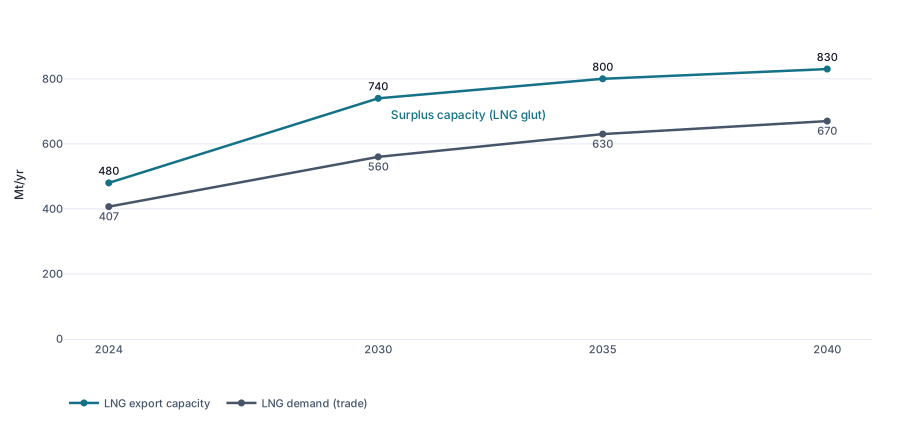
Gas faces no near-term scarcity — reserves run roughly 46 years (Section 2.3) and the structural story is supply, not shortage. A record wave of new liquefaction capacity, led by the United States and Qatar, is set to lift global LNG export capacity from about 480 Mt in 2024 to 740 Mt by 2030 (+54%). Because that capacity is arriving faster than demand, the IEA and Shell expect the market to loosen into surplus from around 2027, with roughly 15% spare liquefaction capacity by 2030 — a buyers’ market that should pressure prices — before demand growth (Shell sees LNG trade up ~65% to ~670 Mt by 2040) gradually reabsorbs it. The risk to the bull case is precisely this glut; the risk to the bear case is a cold winter or a supply shock emptying storage (Section 2.8).
Table 24. Natural gas & LNG outlook, 2024–2050
| Forecast (source · scenario) | 2024 | 2030 | 2040 | 2050 |
|---|---|---|---|---|
| Global gas demand (bcm) — IEA / GECF | ~4,100 | ~4,500 | ~5,000 | ~5,300 |
| LNG demand (Mt) — Shell | 407 | ~560 | ~670 | — |
| LNG export capacity (Mt) — IEA | ~480 | ~740 | ~830 | — |
Source: IEA — Gas 2025 and World Energy Outlook 2025; GECF Global Gas Outlook 2050 ; Shell LNG Outlook 2025 . Figures are scenario projections, not measured data; bcm = billion cubic metres, Mt = million tonnes of LNG.
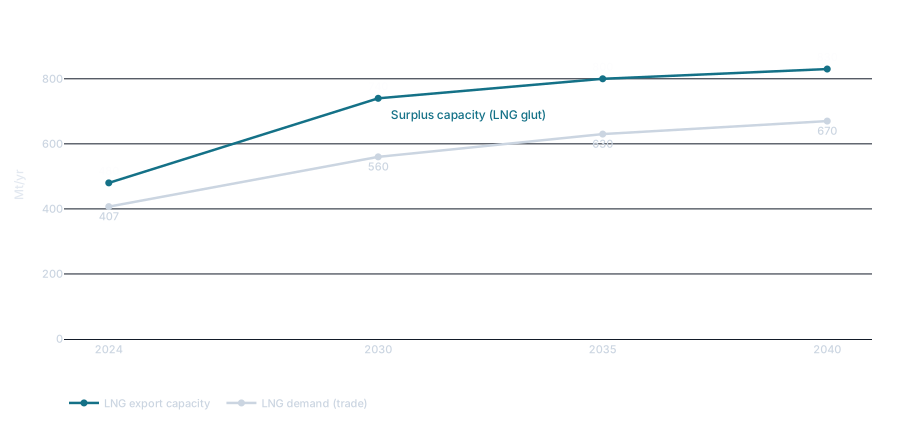
Figure 18. LNG export capacity vs. demand to 2040 (Mt)
Source: IEA — Gas 2025 , 2025; Shell LNG Outlook 2025 . Scenario projection, not measured data.
5.3 Catalysts to watch
The forward watch-list is concrete. In the near term, the path of weather and storage (the EIA weekly report), the start-up of new LNG export terminals (especially in the US and Qatar), and TTF/JKM seasonal demand dominate. Over 3–10 years, the structural themes are the global LNG capacity wave (US and Qatari expansions reshaping trade), surging power demand from electrification and AI data centres, continued coal-to-gas switching in Asia, and the methane-regulation and renewables-competition forces on the other side of the ledger. What would confirm the bull thesis: strong LNG-export pull and power demand against disciplined supply. What would break it: an LNG glut, a mild run of winters, or faster renewable displacement.
Table 25. Natural gas catalyst calendar
| Catalyst / theme | Timing | Why it matters | Watch |
|---|---|---|---|
| EIA weekly storage report | Weekly (Thu) | Moves the US price | eia.gov |
| Winter / summer weather | Seasonal | Heating & cooling demand | Forecasts, HDD/CDD |
| LNG terminal start-ups | Multi-year | Adds export demand | US & Qatar projects |
| TTF / JKM season | Seasonal | Europe & Asia restocking | Storage, spreads |
| Energy Institute Review | Annual (Jun) | Supply-demand update | energyinst.org |
| IEA Gas reports | Quarterly/annual | Market outlook | iea.org |
Source: U.S. EIA , IEA and Energy Institute calendars.
6. Summary
Natural gas is the swing fuel of the modern energy system — clean-burning relative to coal, indispensable to the power grid, and increasingly traded across oceans as LNG. Unlike oil, it has no single world price: it clears in three regional markets — Henry Hub (~$2.21/MMBtu in 2024, ~$3.52 in 2025), TTF and JKM — knitted together by LNG arbitrage. It is produced in a few places — the United States (~26%), Russia, Iran, China and Canada lead — and the US shale revolution made America both the top producer and the top LNG exporter. Demand (~4,128 bcm in 2024) is led by power generation, then industry and buildings, and the growth is in Asia and the Middle East while Europe’s falls. The market clears region by region through storage and weather, with LNG — now roughly half of internationally traded gas — the fast-growing link that lets cheap US gas reach premium buyers. The companies span state giants (Gazprom, QatarEnergy), integrated majors and US shale pure-plays (Expand Energy, EQT), best compared on production, reserves and breakeven, never on a fast-moving market cap. Gas’s regime is its own: weather- and storage-driven, regional and volatile, only loosely tied to the macro cycle or to oil — prone to violent local spikes (Europe 2022) and gluts (US 2024). The single most important variable to watch is the build-out of LNG export capacity against weather, storage and the methane-versus-bridge-fuel debate.
To go from this big-picture view to the actual companies — screening every gas producer by reserves, breakeven and reserve life — explore Metal Pilot.
7. Vocabulary
Every specialised term used in this report, defined once at first use in the body, collected here for reference.
Table 26. Natural gas vocabulary
| Term | Plain-language definition | Why it matters to an investor |
|---|---|---|
| Methane (CH₄) | The main component of natural gas | What is burned; a potent greenhouse gas if leaked |
| Dry / wet gas | Pure methane vs. gas with NGLs | Wet gas carries valuable by-product liquids |
| NGLs | Ethane, propane, butane | Separate revenue stream from processing |
| Conventional / unconventional | Free-flowing vs. shale/tight gas | Shale (frac’d) reshaped US supply |
| Associated gas | Gas produced with oil | Inelastic to the gas price (oil-driven) |
| LNG | Gas liquefied at −162 °C for shipping | Turns regional gas into a global commodity |
| Liquefaction / regasification | Chilling to / warming from liquid | The capital-heavy ends of the LNG chain |
| Henry Hub / TTF / JKM | US / European / Asian benchmarks | Gas has no single world price |
| MMBtu | Million British thermal units | The unit gas is priced in |
| Bcf/d / bcm | Billion cf per day / billion m³ | Flow units for gas |
| Proved reserves | Economically recoverable gas | The longevity measure (Tcm/Tcf) |
| Storage / inventories | Gas held underground | Buffers winter demand; sets short-term price |
| Reserve life (R/P) | Reserves ÷ annual production | Years of supply at current output |
| Breakeven | Price needed for a well to pay back | Who keeps drilling in a downturn |
| Oil-indexed contract | LNG price linked to crude | Legacy pricing, fading vs. hub-indexed |
| Take-or-pay | Buyer must pay for contracted gas | Underpins LNG project financing |
| Coal-to-gas switching | Power plants swapping fuel | A key swing source of gas demand |
| GECF | Gas Exporting Countries Forum | The (weak) “gas OPEC” |
Source: definitions follow the U.S. EIA glossary and Energy Institute conventions, 2025.
8. Sources, methodology & disclaimer
8.1 Sources, methodology & data vintage
Agencies & official data: Energy Institute Statistical Review of World Energy 2025 for production, consumption, reserves and trade; U.S. EIA for Henry Hub prices, LNG trade and storage; IEA gas market analysis for demand and outlooks.
Prices & markets: U.S. EIA Henry Hub ; ICE TTF ; S&P Global Platts JKM ; UN Comtrade for trade flows.
Company filings: annual reports and reserve statements (SEC / NI 51-101) and producer rankings for Gazprom, QatarEnergy, PetroChina/CNPC, ExxonMobil, Shell, TotalEnergies, Expand Energy and EQT, 2024.
Methodology: prices are calendar-year averages of Henry Hub (EIA), never spot snapshots; gas has no single world price, so TTF and JKM are referenced separately. Production, consumption, reserves and trade follow the Energy Institute Statistical Review; end-use shares follow the IEA. Regional splits, pipeline-vs-LNG shares and company figures are approximate and reported on differing bases — each figure is attributed to its source. Correlations use monthly data over 2000–2024 and are historical. Reserves and forecasts are estimates, not measured facts.
Data as of: June 2026. Intended update cadence: annually, after the Energy Institute Statistical Review (June) and as the U.S. EIA and IEA gas data are revised.
8.2 Disclaimer & disclosure
This report is for informational purposes only and is not investment advice, a recommendation, or an offer to buy or sell any security or commodity. Natural gas prices are highly volatile, and the figures here are estimates as of the stated date that will change; reserves, correlations and regime descriptions are estimates and historical observations that may not persist. Do your own research and consult a licensed financial adviser before acting. This report was prepared with the assistance of AI; its figures were sourced from the references above and reviewed, but readers should verify any number before relying on it. The author holds no position disclosed as a conflict in respect of the companies named.