

Uranium — A Complete Market Guide (2026)
Data as of 2 July 2026. Prices are quoted as multi-year and full-year averages, not a single day’s snapshot, so this report stays useful over time. Reserves, production splits, balances, and historical series are estimates from agency data, rounded for clarity. This report is for information only and was prepared with AI assistance — see the disclaimer at the end.
Uranium is the most energy-dense fuel humanity uses — a single pellet the size of a fingertip holds the energy of a tonne of coal — and after a decade in the wilderness it has become one of the most talked-about commodities of the energy transition. In 2024 the spot price touched a 16-year high above $100/lb as a reactor build-out led by China collided with a mine-supply base that still cannot meet demand. This report is the free, big-picture primer on how the uranium market actually works — where it comes from, how the nuclear fuel cycle turns ore into reactor fuel, how its price is set, and which forces drive it. For the company-level data behind the charts — every producer screened by production and resources — go to Metal Pilot.
TL;DR & Key Takeaways
- What it is: a radioactive metal whose only material market is nuclear fuel — roughly 99% of demand. Its value comes from energy density, not industry or adornment, so demand tracks the reactor fleet, not the business cycle.
- Market structure: mine supply (~60,000 tU/yr) is highly concentrated — Kazakhstan alone is ~39%, and Kazakhstan, Canada and Namibia together ~three-quarters. Mines cover only ~90% of reactor needs; the rest comes from secondary supply (inventories, ex-weapons material, enrichment underfeeding).
- The fuel cycle is the story: ore becomes power only after mining → milling (yellowcake) → conversion → enrichment → fuel fabrication. The strategic choke point is enrichment, where Russia controls ~40% of world capacity.
- Demand story: ~440 operable reactors need ~69,000 tU a year, and the pipeline is growing — China is building most of the world’s new reactors, alongside life-extensions, restarts and small modular reactors (SMRs).
- Price regime: uranium is idiosyncratic and event-driven, not cyclical like copper. It is shaped by reactor build-out sentiment, supply discipline, the drawdown of secondary supply, financial buying, and fuel-cycle geopolitics — with long, violent boom-bust cycles.
- Biggest swing factor: the gap between a growing reactor fleet and a slow, concentrated mine-supply pipeline, amplified by Western efforts to de-risk from Russian fuel services.
Numbers to remember (uranium at a glance)
Figure 1. Uranium at a glance
Figure data: World Nuclear Association and OECD-NEA/IAEA Red Book; see Sections 2.1–2.6.
Why it matters now: nuclear power is being rehabilitated as a low-carbon, always-on energy source just as the mine pipeline looks too thin to fuel it — a structural setup that drove uranium’s 2021–2024 re-rating. The big-picture case is below.
How to read this guide: new to uranium? Read straight through from Section 1 — the fuel cycle is the key that unlocks everything else. Here for the investment case? Jump to Section 5 — how to own it (including the physical trusts and their catch), how to screen miners, and what actually drives this idiosyncratic market. Every technical term is defined in the Vocabulary (Section 8).
1. Uranium & the market basics
1.1 What uranium is — physical basics & quality
Uranium (chemical symbol U) is a dense, weakly radioactive metal whose entire economic value rests on one property: its isotope uranium-235 can sustain a nuclear chain reaction, releasing enormous heat that boils water to spin a turbine. Natural uranium is ~99.3% U-238 (which does not readily fission) and only ~0.7% U-235, so most reactors need the U-235 fraction concentrated — the step called enrichment. The energy density is extraordinary: one kilogram of natural uranium, fully used, yields tens of thousands of times the energy of a kilogram of coal. Demand is therefore almost entirely nuclear electricity generation (~99%), with a sliver for research reactors, naval propulsion and medical isotopes. There is no monetary, jewellery or broad-industrial pillar — uranium is a pure energy-fuel commodity.
A few terms define uranium’s quality and form, each used throughout this report:
- Grade (% U₃O₈ or % U) — the concentration of uranium in the ore. Grades vary enormously: Canada’s Athabasca Basin hosts deposits above 15% U₃O₈, while many economic deposits run below 0.1%. Grade, more than the uranium price alone, decides what is economic. (Unlike gold , uranium has no monetary or jewellery pillar — grade and the fuel cycle are the whole story.)
- Conventional vs. in-situ leach (ISL/ISR) — the two mining routes. Conventional mines (open-pit or underground) dig ore and process it in a mill; in-situ leach dissolves uranium underground with a leaching solution pumped through the orebody and recovers it at surface — now over half of world output. Define once: conventional here means mined-and-milled ore, as distinct from ISL.
- Yellowcake (U₃O₈) — the uranium oxide concentrate a mine or ISL plant produces, the form in which uranium is bought, sold and priced.
- Enrichment & SWU — raising the U-235 share from 0.7% to the 3–5% reactors need; the work involved is measured in separative work units (SWU).
- Primary vs. by-product — uranium mined for its own sake (primary) versus uranium recovered alongside copper, gold or phosphate (by-product — e.g. Australia’s Olympic Dam).
The value chain — from ore to reactor. Uranium follows a longer path than any metal: mining → milling (yellowcake, U₃O₈) → conversion (to UF₆ gas) → enrichment (to 3–5% U-235, measured in SWU) → fuel fabrication (pellets and assemblies) → the reactor → spent fuel (storage or reprocessing). The single strategic choke point is enrichment, where capacity is concentrated in a handful of operators and Russia holds the largest share.
Figure 2. The nuclear fuel cycle, ore to reactor
Source: industry fuel-cycle primers; conceptual diagram.
From orebody to yellowcake — the two mining routes. Everything before “conversion” on that chain is simply getting uranium out of the ground and into a drum of oxide powder, and it happens one of two ways. The conventional route mines rock the usual way — open-pit or underground — and sends it to a mill, where the ore is crushed and ground and the uranium is dissolved out by leaching with either sulfuric acid or an alkaline solution; the resulting liquor is purified by ion exchange or solvent extraction, and the uranium is precipitated, dried and packed as yellowcake (U₃O₈) — the oxide concentrate in which uranium is actually bought and sold. The in-situ leach (ISL/ISR) route — now over half of world output, and the reason Kazakhstan is so cheap — skips digging and crushing entirely: a leaching solution is injected through wells straight into a permeable sandstone orebody, dissolving the uranium underground, and the pregnant solution is pumped back to surface and processed to the same yellowcake. Only after yellowcake does uranium enter the fuel cycle proper — conversion to UF₆ gas, then enrichment and fabrication — so the mine’s job ends at U₃O₈, well short of reactor-ready fuel.
1.2 Units & measurement conventions
This report uses the nuclear-industry convention throughout, stated here so every later number is unambiguous. Uranium quantities appear two ways that the reader must convert between: tonnes of uranium metal (tU), used by the World Nuclear Association (WNA), the OECD-NEA and the IAEA for production and demand; and pounds of U₃O₈ (lb U₃O₈), the “yellowcake” unit in which the metal is priced. The conversion is fixed: U₃O₈ is ~84.8% uranium by mass, so 1 tonne U = 1.179 tonnes U₃O₈ = 2,600 lb U₃O₈. Price is quoted in US dollars per pound U₃O₈ (USD/lb). Enrichment work is measured in separative work units (SWU) and priced separately ($/SWU); conversion is priced in $/kgU as UF₆. Ore grade is % U₃O₈.
Crucially, uranium figures split into flow and stock, and the two must not be confused:
- Flow — quantities per year: mine production (~60,000 tU/yr), reactor requirements (~69,000 tU/yr), secondary supply (the ~8,000–9,000 tU/yr gap-filler).
- Stock — a level at a point in time: identified resources (the economically recoverable endowment, ~5.9 Mt U to $130/kgU), commercial and government inventories (the stockpiles utilities and traders hold), and the enrichment “tails” left over from past work.
Table 1. Uranium units and conversions
| Unit | Meaning | Typical magnitude in uranium | Conversion |
|---|---|---|---|
| tU | Tonne of uranium metal | National & global flows | 2,600 lb U₃O₈ |
| lb U₃O₈ | Pound of yellowcake | The price-quote unit | 0.000385 tU |
| Mlb U₃O₈ | Million pounds yellowcake | Company annual output | ~385 tU |
| SWU | Separative work unit | Enrichment effort (priced separately) | — |
| % U₃O₈ | Ore grade | Athabasca >15%; ISL deposits <0.1% | — |
| Mt U | Million tonnes uranium | World resource base | 1,000,000 tU |
Source: World Nuclear Association , 2026; OECD-NEA/IAEA, Uranium 2024 (“Red Book”) , 2025.
Numbers intuition: a large uranium mine produces 2,000–8,000 tU/yr (Canada’s McArthur River is the biggest single mine); total annual mine supply (~60,000 tU ≈ 156 Mlb U₃O₈) is worth only about $12 billion at recent prices — tiny next to copper or gold, yet it fuels ~9% of the world’s electricity. Uranium is strategically enormous and financially small.
1.3 Pricing & benchmarks
Uranium has the most unusual pricing of any commodity in this series, and the rule here is to quote averages, not a single day’s snapshot. There is no liquid exchange floor like the LME; instead two price-reporting agencies, UxC and TradeTech, publish the reference numbers, and two prices matter. The spot price (USD/lb U₃O₈) covers immediate, one-off purchases and is thin and volatile — it grabs headlines but represents a small share of volume. The long-term contract price is where most uranium actually trades: utilities sign multi-year contracts with producers, because securing fuel for a reactor that runs for decades matters more than chasing the spot. Spot and term prices can diverge widely. Separately, conversion and enrichment (SWU) are priced on their own, so the delivered cost of reactor fuel blends four prices, not one.
Two newer features have reshaped the spot market. The Sprott Physical Uranium Trust (SPUT) and similar vehicles buy and hold physical pounds, turning investor demand into real spot demand — a major driver of the 2021 rally. And CME uranium futures now offer a hedging tool the market historically lacked. Even so, uranium remains a contract market at heart.
Table 2. Key uranium price benchmarks
| Benchmark | What it prices | Source | Role |
|---|---|---|---|
| Spot U₃O₈ | Immediate yellowcake | UxC / TradeTech | Headline price; thin, volatile |
| Long-term price | Multi-year contracts | UxC / TradeTech | Where most volume trades |
| Conversion (UF₆) | Converting yellowcake | UxC / TradeTech | A separate fuel-cycle price |
| Enrichment (SWU) | Separative work | UxC / TradeTech | The largest fuel-cost component |
Source: UxC Nuclear Fuel Price Indicators , 2025; Cameco uranium price , 2025.
The long-run price story is one of two dramatic cycles. A 2003–2007 boom drove spot from under $10/lb to a ~$136/lb peak in mid-2007, which then crashed; the March 2011 Fukushima accident sent it into a brutal multi-year bear market, bottoming near $18/lb in 2016 as reactors shut and secondary supply flooded the market. Producer cuts and a nuclear-policy revival then drove a recovery: spot averaged ~$84/lb in 2024 (touching a 16-year high above $106/lb in January 2024) and ~$74/lb in 2025.
Table 3. Average annual uranium spot price, 2000–2025 (USD/lb U₃O₈)
| Year | 2000 | 2001 | 2002 | 2003 | 2004 | 2005 | 2006 | 2007 | 2008 | 2009 | 2010 | 2011 | 2012 |
|---|---|---|---|---|---|---|---|---|---|---|---|---|---|
| Price | 8 | 9 | 10 | 12 | 18 | 28 | 48 | 99 | 64 | 46 | 46 | 57 | 49 |
| Year | 2013 | 2014 | 2015 | 2016 | 2017 | 2018 | 2019 | 2020 | 2021 | 2022 | 2023 | 2024 | 2025 |
|---|---|---|---|---|---|---|---|---|---|---|---|---|---|
| Price | 39 | 33 | 37 | 26 | 22 | 24 | 26 | 30 | 35 | 50 | 62 | 84 | 74 |
Source: annual averages of spot U₃O₈, UxC / TradeTech (industry estimates), 2000–2025. Spot is one channel; most uranium trades on long-term contracts at different prices.
Figure 3. Average annual uranium spot price, 2000–2025 (USD/lb U₃O₈)
Figure data: Table 3.
2. Supply, demand & the market balance
2.1 Where uranium is mined — deposits & geology
Uranium supply is geographically concentrated, and the deposit type largely dictates the mining method and cost. The highest-grade deposits on Earth are the unconformity-related orebodies of Canada’s Athabasca Basin (Saskatchewan) — McArthur River and Cigar Lake run grades ten to a hundred times the world average and are mined underground. The largest volume of supply comes from sandstone-hosted deposits amenable to in-situ leach, above all in Kazakhstan (and Uzbekistan and the United States), where low grades are offset by very low ISL operating costs. Other major sources are Namibia’s large, low-grade open-pit deposits (Husab, Rössing), Australia’s Olympic Dam, where uranium is a by-product of a giant copper mine, and Niger’s sandstone and vein deposits.
In 2024 Kazakhstan, Canada, Namibia, Australia and Uzbekistan led output and together accounted for about 88% of global mine production — among the most concentrated of any commodity. Kazakhstan alone was 39%. Mining methods have shifted decisively toward ISL, which was over half of 2024 output.
Table 4. Leading uranium-mining countries, 2024
| Rank | Country | Mine output (tU) | Share of world | Trend |
|---|---|---|---|---|
| 1 | Kazakhstan | 23,270 | 39% | Flat/managed |
| 2 | Canada | 14,309 | 24% | Rising (restarts) |
| 3 | Namibia | 7,333 | 12% | Rising |
| 4 | Australia | 4,598 | 8% | Flat |
| 5 | Uzbekistan | 4,000 | 7% | Rising |
| 6 | Russia | 2,738 | 5% | Flat |
| 7 | China | 1,600 | 3% | Flat |
| 8 | Niger | 962 | 2% | Falling (2023 coup) |
| 9 | India | 500 | 1% | Flat |
| 10 | Ukraine | 288 | <1% | Falling (war) |
| — | Rest of world | 615 | 1% | — |
| — | World total | 60,213 | 100% | Rising |
Source: World Nuclear Association, Uranium Production by Country , January 2026. Figures rounded; shares are approximate.
Figure 4. Leading uranium-mining countries, 2024 (tU)
Figure data: Table 4.
At the asset level uranium is the most concentrated market in this series: the two Athabasca mines alone produce about a fifth of the world’s uranium, and the top eight mines roughly half. The grade contrast in the table is the industry’s defining spread — Cigar Lake ore is literally a hundred times richer than the ISL deposits that produce the largest volumes.
Table 5. Largest uranium mines, 2024 (approximate output)
| Mine | Country | Operator / owners | Output (tU, ≈) | Method & grade note |
|---|---|---|---|---|
| Cigar Lake | Canada | Cameco / Orano | ~6,900 | Underground; ~15% U₃O₈, world’s highest grade |
| McArthur River | Canada | Cameco / Orano | ~5,900 | Underground; restarted 2022 after 4-year suspension |
| Husab | Namibia | CGN (Swakop) | ~3,500 | Open pit; large, low grade |
| Inkai | Kazakhstan | Kazatomprom / Cameco JV | ~2,900 | ISL; low cost |
| Olympic Dam | Australia | BHP | ~2,700 | By-product of a giant copper mine |
| Rössing | Namibia | CNNC | ~2,400 | Open pit; operating since 1976 |
| Budenovskoye | Kazakhstan | Kazatomprom / Rosatom JV | ~2,000 | ISL; ramping up |
| Four Mile | Australia | Quasar Resources | ~1,300 | ISL |
Source: World Nuclear Association mine-level production data and company reports, 2024. Mine-level output on a 100% basis; figures approximate and rounded — several Kazakh ISL operations of similar size sit just below the table. Screen every producing asset on Metal Pilot.
2.2 Demand & consumption
Uranium demand is, almost entirely, a function of the nuclear reactor fleet. About 440 operable reactors generate ~9% of the world’s electricity and need roughly 69,000 tU a year (the WNA’s 2025 reactor-requirements figure). That averages about 155–160 tU per reactor per year, though the real number scales with reactor size: a typical 1,000 MWe reactor consumes on the order of 160–200 tU of natural uranium annually — which, after enrichment, becomes roughly 27 tonnes of finished fuel loaded in batches every 12–24 months. Crucially, this demand is highly price-inelastic: fuel is a small share of the cost of running a reactor, and a reactor must be fuelled regardless of the uranium price, so utilities buy on long-term contracts to guarantee supply. The ~1% of demand outside power generation is research reactors, naval propulsion and medical-isotope production.
Reactor requirements are led by the countries with the largest fleets. The United States — with 94 operable reactors — is by far the biggest consumer at ~19,000 tU, followed by China (~13,900 tU and rising fastest), France (~8,400 tU), Russia (~6,300 tU) and South Korea (~4,700 tU), with Japan, India, Canada, Spain and Sweden rounding out the top ten. The decisive trend is China, which not only consumes more each year but is building the majority of the world’s new reactors.
Table 6. Uranium requirements by country, 2025 (tU)
| Country | Reactors operable | Uranium required (tU) | Share |
|---|---|---|---|
| United States | 94 | 19,011 | 28% |
| China | 61 | 13,872 | 20% |
| France | 57 | 8,389 | 12% |
| Russia | 34 | 6,251 | 9% |
| South Korea | 26 | 4,703 | 7% |
| Japan | 33 | 2,135 | 3% |
| India | 24 | 1,884 | 3% |
| Canada | 17 | 1,455 | 2% |
| Spain | 7 | 1,218 | 2% |
| Sweden | 6 | 968 | 1% |
| Rest of world | 79 | 9,034 | 13% |
| World total | 438 | 68,920 | 100% |
Source: World Nuclear Association, World Nuclear Power Reactors & Uranium Requirements , updated 2 July 2026 (uranium requirements from the WNA Nuclear Fuel Report 2025 reference scenario). Japan’s requirement reflects its full fleet including reactors restarting from post-Fukushima idling.
Figure 5. Uranium requirements by country, 2025
Figure data: Table 6 — the donut breaks out the five largest consumers and groups all smaller fleets (including Japan, India, Canada, Spain and Sweden) as “rest of world”.
The reactor fleet — and so uranium demand — fell after Fukushima as Japan idled its reactors and Germany began its phase-out, then stabilised and is now growing again. The growth is overwhelmingly in Asia: of the ~80 reactors under construction worldwide, China alone is building ~39, with India, Russia and the Middle East adding more, while Western fleets are flat-to-shrinking but increasingly extending the lives of existing reactors. Layered on top are small modular reactors (SMRs) and a wave of demand interest from technology companies seeking firm, low-carbon power for AI data centres.
Table 7. Uranium requirements by region, selected years (tU, approximate)
| Region | 2000 | 2010 | 2020 | 2025 |
|---|---|---|---|---|
| North America | 22,000 | 22,500 | 20,000 | 20,500 |
| Europe (incl. UK) | 23,000 | 22,000 | 17,500 | 16,500 |
| China | 1,000 | 3,500 | 10,500 | 13,900 |
| Other Asia | 12,000 | 13,500 | 11,000 | 11,000 |
| Russia & CIS | 6,000 | 6,500 | 6,500 | 7,000 |
| World total | ~64,000 | ~68,000 | ~65,500 | ~68,900 |
Source: World Nuclear Association reactor-requirements series; regional splits are approximate. China is split out as its own category given the pace of its reactor build-out — the defining demand trend. The remaining rows condense the standard Energy Institute region set because reactor demand is negligible outside them: South & Central America, the Middle East and Africa together run only a handful of reactors, so they are folded into the world total rather than shown as separate near-zero rows.
Figure 6. Uranium requirements by region, 2000–2025 (tU)
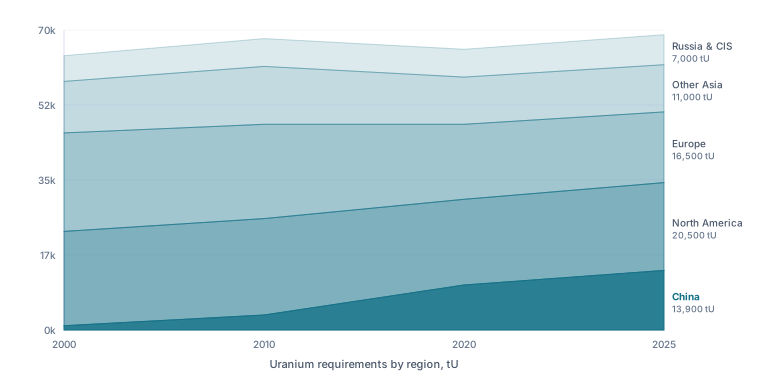
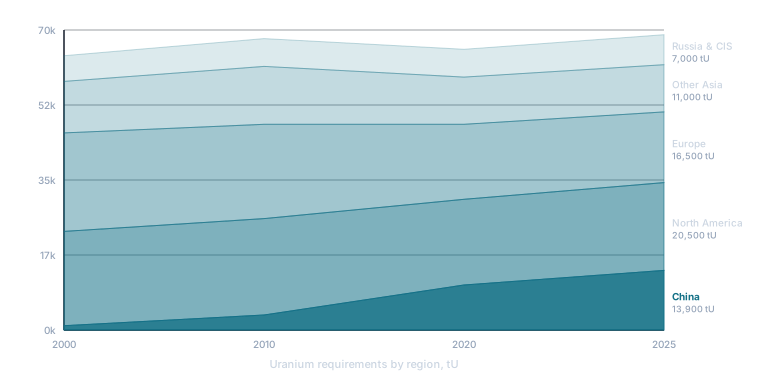
Figure data: Table 7.
2.3 Supply: producing countries
Annual uranium supply has two parts — newly mined metal and secondary supply (Section 2.5) — plus the separate fuel-cycle stages of conversion and enrichment. Mine production has been volatile: it climbed through the 2000s, peaked above 63,000 tU in 2016, fell sharply when producers idled mines into the post-Fukushima glut (down to ~47,700 tU in 2020), and rebounded to 60,213 tU in 2024 as Canada’s Cigar Lake and McArthur River ran at full tilt and Kazakhstan lifted output. State influence is heavy: over half of mine production comes from state-owned companies (Kazakhstan’s Kazatomprom, Russia’s Rosatom, France’s Orano, China’s CGN and CNNC).
Table 8. World uranium mine production, selected years (tU)
| Year | 2000 | 2005 | 2010 | 2015 | 2018 | 2020 | 2022 | 2024 |
|---|---|---|---|---|---|---|---|---|
| Mine production | 34,700 | 41,700 | 53,700 | 60,300 | 54,200 | 47,700 | 49,600 | 60,200 |
Source: World Nuclear Association, World Uranium Mining Production , 2026. Figures rounded.
Resources tell the longevity story, and here Australia dominates: it holds ~28% of the world’s ~5.9 million tonnes of identified resources recoverable to $130/kgU, followed by Kazakhstan, Canada, Namibia and Russia. At ~60,000 tU of annual mine supply, that resource base implies a reserve life well over 90 years (and the resource recoverable at higher prices is larger still, ~7.9 Mt U to $260/kgU) — uranium scarcity is an economic and geopolitical question, not a geological one.
Table 9. Top uranium resources by country, 2023 (tU, to $130/kgU)
| Country | Resources (tU) | Country | Resources (tU) |
|---|---|---|---|
| Australia | 1,671,200 | South Africa | 320,900 |
| Kazakhstan | 813,900 | China | 270,500 |
| Canada | 582,000 | Brazil | 167,800 |
| Namibia | 497,900 | Mongolia | 144,600 |
| Russia | 476,600 | Ukraine | 106,700 |
| Niger | 336,000 | World total | ~5,925,700 |
Source: OECD-NEA/IAEA, Uranium 2024 (“Red Book”), reasonably assured plus inferred resources to $130/kgU, 1 Jan 2023, as reproduced by the World Nuclear Association .
Figure 7. World uranium mine production, 2000–2024 (tU)
Figure data: Table 8.
2.4 The supply–demand balance
Uranium’s balance is defined by a persistent primary-supply deficit: mines simply do not produce enough to meet reactor requirements. In 2024 mine output of ~60,200 tU covered about 90% of demand, and in the depths of the post-Fukushima cuts it covered as little as ~73%. The gap is filled by secondary supply — drawing down commercial and government inventories, re-enriching depleted “tails” (underfeeding), and historically the dilution of ex-weapons uranium. Because those secondary sources are finite and shrinking, the structural question is whether enough new mines can be built to close the gap as the reactor fleet grows. The series below charts the deficit that is the post’s central thesis; the multi-year outlook is detailed in Section 6.
Table 10. Mine supply vs. reactor requirements, selected years (tU)
| Year | 2015 | 2018 | 2020 | 2022 | 2024 |
|---|---|---|---|---|---|
| Mine production | 60,300 | 54,200 | 47,700 | 49,600 | 60,200 |
| Reactor requirements | ~66,000 | ~65,500 | ~65,500 | ~66,500 | ~68,000 |
| Mine coverage | ~91% | ~83% | ~73% | ~75% | ~89% |
Source: production from the World Nuclear Association ; requirements from the WNA reactor-requirements series . Requirements approximate and rounded; the shortfall in every year is met by secondary supply.
Figure 8. The primary-supply deficit, 2015–2024
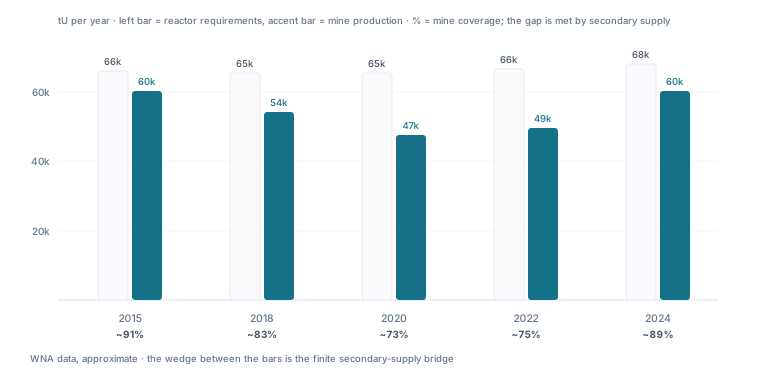
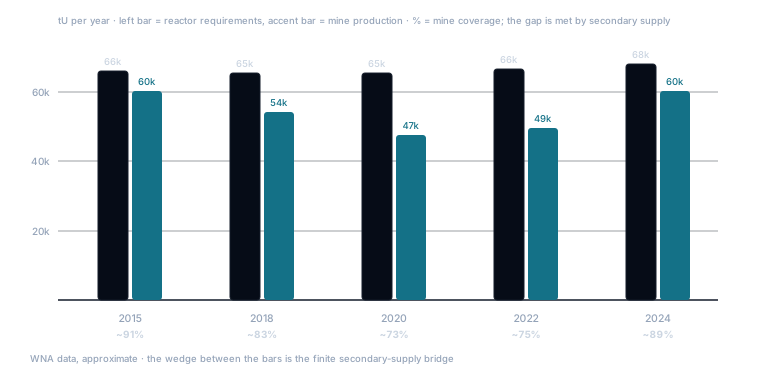
Figure data: Table 10.
At the country level, the split is stark between a few net-mining nations that export almost all they produce (Kazakhstan, Canada, Namibia, Australia mine far more than their — often zero — reactor needs) and the large net-importing consumers (the United States, China, France and South Korea mine little but run big fleets). The United States is the extreme case: it consumes ~19,000 tU but mines only a few hundred, importing nearly all its uranium and most of its enrichment.
Table 11. Uranium net positions, major countries, 2024 (tU)
| Country | Mine output | Reactor requirement | Net position |
|---|---|---|---|
| Kazakhstan | 23,270 | ~0 | +23,270 (net exporter) |
| Canada | 14,309 | ~1,455 | +12,854 (net exporter) |
| Namibia | 7,333 | ~0 | +7,333 (net exporter) |
| United States | 260 | ~19,011 | −18,751 (net importer) |
| China | 1,600 | ~13,872 | −12,272 (net importer) |
Source: production from WNA , 2024; requirements from WNA , 2025. Figures approximate.
Figure 9. Uranium net positions, major countries, 2024 (tU)
Figure data: Table 11.
2.5 Supply structure
Uranium supply has a structure unlike any metal in this series. The bulk is primary-mined, split by method into in-situ leach (~52%), conventional underground and open-pit (~44%) and by-product (~4%) — the last almost entirely Australia’s Olympic Dam, where uranium rides along with copper and is largely inelastic to the uranium price. Within primary supply, the shift to ISL has lowered the industry’s cost base and its environmental footprint per pound.
The defining feature, though, is secondary supply — the sources that bridge the ~8,000–9,000 tU gap between mines and reactors. These include drawdowns of commercial and government inventories, enrichment underfeeding (re-processing depleted tails when enrichment is cheap relative to uranium), small volumes of reprocessed uranium and MOX fuel (mainly France, Russia and Japan), and historically the HEU downblending of Russian and US weapons uranium — the “Megatons to Megawatts” programme that supplied a large share of demand until it ended in 2013. Unlike copper, uranium is not meaningfully recycled at scale: spent-fuel reprocessing is limited and most countries store spent fuel rather than recycle it. As secondary supply shrinks, the market leans ever more on mines.
Table 12. Uranium supply structure, 2024
| Supply source | Approx. share | Price elasticity |
|---|---|---|
| Mine — in-situ leach (ISL) | ~52% of mine | Medium (low-cost, flexible) |
| Mine — underground & open-pit | ~44% of mine | Low (long lead times) |
| Mine — by-product (e.g. Olympic Dam) | ~4% of mine | Very low (copper-driven) |
| Memo: secondary supply | ~10% of total requirements | Finite & shrinking |
Source: World Nuclear Association , 2024; mining-method split is of mine production, secondary supply is of total reactor requirements.
Figure 10. Uranium mine production by method, 2024 (% of mine output)
Figure data: Table 12.
2.6 Trade flows: the fuel cycle as the choke point
Uranium’s trade map is really the fuel cycle’s map, and its vulnerabilities sit downstream of the mine. Raw yellowcake flows from a handful of producers — Kazakhstan, Canada, Namibia, Australia — to conversion and then enrichment facilities, before fabricated fuel reaches utilities in the United States, Europe, China and beyond. Because uranium is compact and high-value-per-tonne, there are no bulk-shipping choke points of the oil or copper kind; the strategic concentration is instead in the fuel-cycle services, above all enrichment, where Russia (Rosatom) holds ~40% of world capacity (some estimates put Rosatom’s share at 44–46%), with Europe’s Urenco, France’s Orano and China’s enrichers making up most of the rest, and the United States only a small share.
This concentration has become the market’s defining geopolitical risk. After Russia’s 2022 invasion of Ukraine, Western utilities moved to de-risk from Russian fuel services, and in 2024 the United States banned imports of Russian enriched uranium (with waivers permitting some supply through 2027–2028 while domestic and allied capacity is rebuilt). Even Kazakhstan’s uranium, the world’s largest source, has historically transited Russia for export — adding a routing risk to a market already short of Western enrichment. The trade story, in short, is less about moving ore than about who can turn it into reactor-ready fuel.
Table 13. Major uranium fuel-cycle roles
| Player | Role | Position |
|---|---|---|
| Kazakhstan / Canada / Namibia / Australia | Largest mine & yellowcake exporters | Net exporters |
| Russia (Rosatom) | ~40% of world enrichment; conversion | Dominant fuel-cycle supplier |
| Europe (Urenco) / France (Orano) | Enrichment & conversion | Western capacity core |
| United States | Large consumer, small enrichment | Net importer, rebuilding capacity |
| China (CGN / CNNC) | Mining, enrichment & fastest-growing demand | Net importer |
Source: World Nuclear Association, Uranium Enrichment and UN Comtrade , 2024–2025.
Figure 11. Global uranium fuel-cycle flows
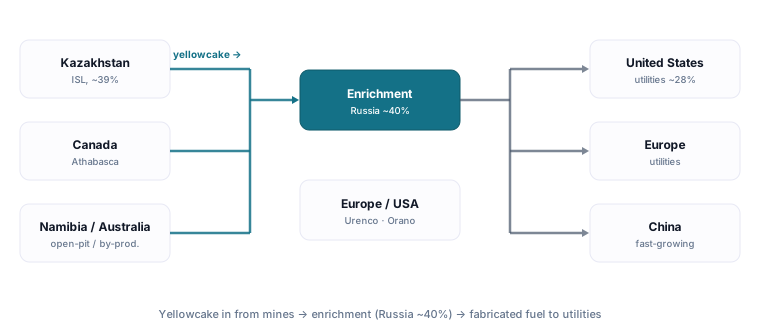
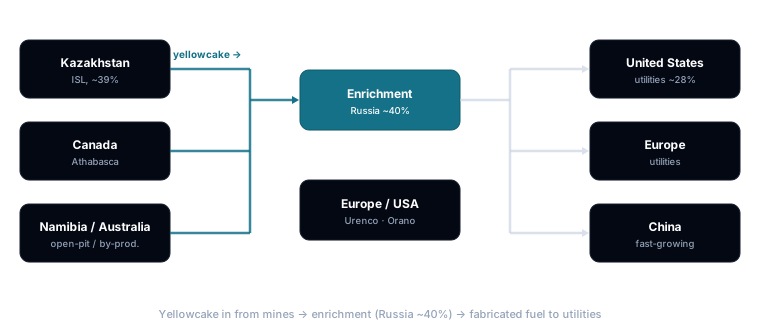
Source: WNA and UN Comtrade, 2024–2025; see Table 13.
2.7 Market organisations & supply coordination
Uranium has no OPEC setting quotas, but it is among the most state-dominated commodities, and coordination shows up in two ways. First, production discipline by state producers: more than half of mine output comes from state-owned companies, and the largest — Kazakhstan’s Kazatomprom — has repeatedly flexed output up and down to manage the market, behaving like a swing producer (its 2024–2025 production-target shortfalls helped drive the price spike). Second, and more powerfully, Russia’s grip on the fuel cycle (Section 2.6) — leverage no miner has, and the reason fuel-cycle independence has become a Western policy priority.
The bodies that shape the market are mostly informational and regulatory rather than price-setting: the World Nuclear Association (WNA) publishes the authoritative supply-demand outlook (its Nuclear Fuel Report); the OECD-NEA and IAEA co-author the “Red Book” resource assessment and the IAEA runs safeguards against weapons proliferation; and the Euratom Supply Agency oversees EU supply diversification. History also offers a cautionary tale: a 1970s uranium producers’ cartel briefly fixed prices, a concluded episode that ended in litigation — a reminder that uranium’s small, opaque market is unusually susceptible to coordination.
Table 14. Uranium market bodies and where the leverage sits
| Body / actor | Role | Leverage |
|---|---|---|
| Kazatomprom (Kazakhstan) | Largest, lowest-cost producer | Swing-producer output discipline |
| Rosatom (Russia) | Mining + ~40% of enrichment | Fuel-cycle chokehold |
| WNA | Industry outlook & data | The Nuclear Fuel Report |
| OECD-NEA / IAEA | Resources & safeguards | The “Red Book”; non-proliferation |
| Euratom Supply Agency | EU supply security | Diversification mandate |
Source: World Nuclear Association , OECD-NEA , IAEA , Euratom Supply Agency , 2025.
Figure 12. World uranium enrichment capacity by supplier (approx. share)
Source: World Nuclear Association, Uranium Enrichment , 2024–2025; shares are approximate.
2.8 Strategic reserves & inventories
Uranium has no single price-moving stockpile like oil’s Strategic Petroleum Reserve, but inventories are the market’s shock absorber — the buffer that has quietly covered the mine-to-reactor gap for years, and the reason the structural deficit of Section 2.4 has not yet forced a supply crisis. The largest pool is commercial inventory: utilities, producers and traders hold multi-year working stocks, and utilities typically carry two-to-three years of forward cover so a reactor is never caught short — which is also why a wave of inventory restocking can tighten the spot market quickly, as it did in 2023–2024. On top sit government stockpiles: the US Department of Energy holds large inventories of natural and enriched uranium and depleted tails, and in 2020 Washington began seeding a Strategic Uranium Reserve (initial ~$75 million) to buy domestically-produced uranium and support home-grown mining and conversion; China is widely believed to be building strategic uranium stocks as it expands its fleet. The historic giant, now spent, was the “Megatons to Megawatts” programme, which down-blended Russian weapons uranium into reactor fuel and supplied a large share of world demand until it ended in 2013 (Section 2.5). The through-line is that these stocks are finite and drawing down, so each passing year the market leans a little harder on the mines — the tightening that underlies the deficit thesis.
Source: World Nuclear Association, Uranium Markets and Military Warheads as a Source of Nuclear Fuel ; US EIA Uranium Marketing Annual , 2024–2025.
3. Nuclear reactors & the fleet
Uranium demand begins and ends with the machines that burn it. Section 2.2 counted the fleet — ~440 operable reactors needing ~69,000 tU a year — but a market guide has to open the box: what these reactors are, how they turn a uranium pellet into electricity, how long they keep running, and what the next generation — small modular reactors above all — will look like. Reactor design is not a side topic for a uranium investor: it dictates how much uranium a plant needs, at what enrichment level, and for how many decades — the three variables behind the demand curve of Section 2.2.
3.1 Reactor types & how they work
A nuclear reactor is, at heart, a controlled version of the chain reaction described in Section 1.1: a moderator slows the neutrons thrown off by fissioning U-235 so they can split more atoms, while a coolant carries the heat away to boil water and drive a turbine. Almost every commercial reactor is a thermal reactor, and the choice of moderator and coolant is what defines its “type”. The workhorse is the pressurised water reactor (PWR) — roughly 70% of the fleet — which uses ordinary (“light”) water as both moderator and coolant, held under pressure so it reaches ~320 °C without boiling and passes its heat to a separate steam loop; it runs on uranium enriched to 3–5% U-235. The boiling water reactor (BWR), ~14%, lets the water boil directly in the core, a simpler single-loop design. The pressurised heavy water reactor (PHWR/CANDU), ~11%, uses heavy water (deuterium oxide), a moderator efficient enough to sustain fission on natural, unenriched uranium — skipping the enrichment step entirely and refuelling online. The rest are graphite-moderated designs: Russia’s water-cooled RBMK/LWGR (the Chernobyl type, now being retired) and Britain’s CO₂-cooled gas-cooled reactors (AGR/Magnox) — plus a small number of fast reactors that use no moderator at all (Section 3.2).
The type matters to the uranium market because it sets the fuel spec. PWRs and BWRs — together ~84% of the fleet — anchor demand for enrichment services, and so for the Russia-dominated enrichment chokepoint of Section 2.6, while CANDUs consume natural uranium with no SWU at all. Fast and advanced reactors, discussed below, need more highly enriched fuel than today’s fleet — the single biggest fuel-cycle wrinkle in the SMR story.
Table 15. World reactor fleet by type
| Reactor type | Moderator / coolant | ~Share of fleet | Fuel | Where |
|---|---|---|---|---|
| Pressurised water (PWR) | Light water / light water | ~70% | Enriched 3–5% | US, France, China, Russia (VVER) |
| Boiling water (BWR) | Light water / light water | ~14% | Enriched 3–5% | US, Japan |
| Pressurised heavy water (PHWR/CANDU) | Heavy water / heavy water | ~11% | Natural uranium | Canada, India |
| Light-water graphite (RBMK/LWGR) | Graphite / light water | ~2% | Enriched (low) | Russia (retiring) |
| Gas-cooled (AGR/Magnox) | Graphite / CO₂ | ~2% | Enriched (low) | United Kingdom |
| Fast reactor (FBR) & HTGR | None / liquid metal or gas | ~1% | HEU / HALEU | Russia, China (demo) |
Source: World Nuclear Association, Nuclear Power Reactors and IAEA PRIS , 2025. Shares of ~440 operable reactors; rounded.
Figure 13. World reactor fleet by type
Figure data: Table 15.
3.2 Reactor generations, Gen I to Gen IV
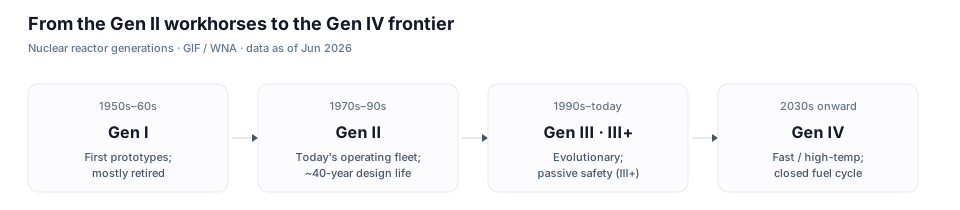
Reactors are grouped into generations that track the technology’s maturity, and knowing which is which explains both today’s fleet and tomorrow’s pipeline. Generation I were the 1950s–60s prototypes, now almost all retired. Generation II — the PWRs, BWRs, CANDUs and RBMKs built from the 1970s to the 1990s — are the workhorses that make up the overwhelming majority of the operating fleet, designed for a nominal 40-year life with active safety systems. Generation III and III+ are the evolutionary upgrades now being built: better fuel, higher thermal efficiency, standardised designs, and — in III+ — passive safety systems that cool the core by gravity and natural convection without operator action or grid power. The reactors going up today are almost all Gen III+: Westinghouse’s AP1000, the Franco-German EPR, South Korea’s APR-1400, Russia’s VVER-1200 and China’s Hualong One.
Generation IV is the research-and-demonstration frontier — six concepts selected by an international forum, most of them fast reactors that use no moderator and run on a fast neutron spectrum, cooled by liquid sodium or lead, molten salt, or helium. Their promise is a near-closed fuel cycle: fast reactors can breed more fissile material than they consume and can burn long-lived waste and existing stockpiles, wringing far more energy from the same uranium and shrinking the disposal problem of Section 5.5. Most Gen IV designs are a decade or more from commercial scale, but — crucially for the fuel market — many of the small modular reactors now attracting capital are Gen IV designs that will need HALEU fuel (Section 3.4).
Table 16. Nuclear reactor generations
| Generation | Era | Defining feature | Examples |
|---|---|---|---|
| Gen I | 1950s–1960s | First prototypes | Shippingport, early Magnox (mostly retired) |
| Gen II | 1970s–1990s | The operating fleet; ~40-yr design life | PWR, BWR, CANDU, RBMK |
| Gen III / III+ | 1990s–today | Evolutionary; passive safety (III+) | AP1000, EPR, APR-1400, VVER-1200, Hualong One |
| Gen IV | ~2030s onward | Fast/high-temp; closed fuel cycle | SFR, LFR, MSR, GFR, SCWR, VHTR |
Source: Generation IV International Forum and World Nuclear Association, Generation IV Nuclear Reactors , 2025.
Figure 14. The four reactor generations
Source: Generation IV International Forum and WNA; see Table 16.
3.3 Plant life & license renewal
A reactor’s economic value — and its lifetime uranium appetite — depends on how many years it operates, and here the story has shifted dramatically in nuclear’s favour. Plants were originally licensed for a 40-year design life, but that figure was a regulatory and financing convention, not a physical limit: with component replacement and ageing-management programmes, the major structures can run far longer. In the United States the NRC grants 20-year license renewals, and about 90% of US reactors have already renewed once, to 60 years; a second round — subsequent license renewal (SLR), taking plants to 80 years — has now been granted to reactors such as Florida’s Turkey Point and Pennsylvania’s Peach Bottom, and the industry expects the great majority of today’s reactors to target 80 years, with studies already probing 100. Life extension is by far the cheapest source of “new” nuclear capacity, and every reactor whose life is extended keeps buying uranium for decades longer than early demand models assumed — a quiet but powerful support under the demand curve.
The counter-pressure is age. The global fleet’s average age reached about 32 years at the start of 2025, and a large cohort built in the 1970s–80s is nearing the end of even its extended licences. That creates a two-sided outlook: life-extensions and restarts (Section 6) prop demand up in the near term, but from the 2030s a wave of retirements will bite unless new build and SMRs replace it — the same fleet-turnover dynamic behind the supply-demand gap of Section 6.2.
Table 17. Reactor operating life & license renewal (US framework)
| Milestone | Operating life | Status |
|---|---|---|
| Original operating licence | 40 years | The historical design-life convention |
| License renewal (LR) | 40 → 60 years | ~90% of US reactors already granted |
| Subsequent license renewal (SLR) | 60 → 80 years | Granted (Turkey Point, Peach Bottom, Surry…) |
| Second SLR / studies | 80 → 100 years | Under research |
Source: US NRC — Reactor License Renewal and Subsequent License Renewal ; IAEA , 2025. Framework is US; other regulators run comparable periodic-review regimes.
Figure 15. Global reactor fleet by age
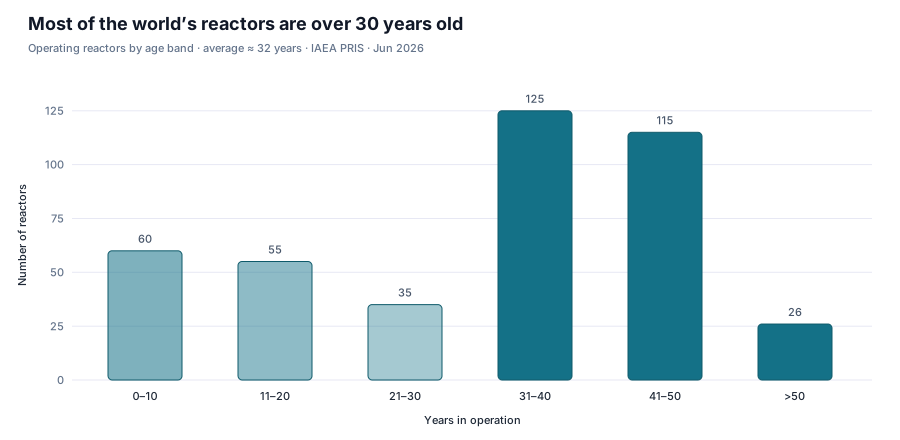
Figure data: IAEA PRIS reactor age distribution , 2025; illustrative bands.
3.4 Small modular reactors & advanced designs
The most-hyped forward theme in nuclear is the small modular reactor (SMR) — broadly, any design under ~300 MWe per module (against ~1,000+ MWe for a conventional plant), with microreactors smaller still at under ~10–20 MWe. The pitch is to swap the industry’s chronic problem — giant, bespoke, over-budget megaprojects — for factory-built, standardised modules that ship to site, install in parallel, scale up unit by unit, and site flexibly beside industry, remote grids, or AI data centres. That last market has turned from theory to contracts: Microsoft underwrote the restart of Three Mile Island Unit 1 (the ~835 MW Crane Clean Energy Center, targeted ~2027), Amazon put ~$700m into X-energy, Google committed to Kairos Power reactors, and Meta signed for several gigawatts — roughly 10 GW of nuclear announced for data centres in all.
Reality is earlier-stage than the headlines. Genuinely operating SMRs are so far only in China and Russia: Russia’s floating Akademik Lomonosov (two 35 MWe units, since 2020), China’s pebble-bed HTR-PM (grid-connected 2021), and China’s Linglong One (ACP100), the first commercial land-based SMR, now in commissioning. In the West the leaders are still building or licensing: GE Hitachi’s BWRX-300 began construction at Darlington, Ontario in 2025 (targeting ~2029–30); TerraPower’s Natrium sodium fast reactor is under construction in Wyoming; and NuScale, Rolls-Royce SMR, X-energy and Kairos are in advanced licensing. The central fuel-cycle catch: most advanced (non-light-water) designs need HALEU — high-assay low-enriched uranium at ~5–20% U-235 — a product today made almost entirely in Russia, so scaling SMRs would deepen the very enrichment dependency the West is trying to escape (Section 2.6). For the uranium market, SMRs are a real but gradual demand-side upside layered on top of the existing fleet, not an overnight step-change — and a forward catalyst tracked in Section 6.3.
Table 18. Leading SMR & advanced-reactor designs
| Design | Developer | Type | ~Capacity | Status (2026) |
|---|---|---|---|---|
| BWRX-300 | GE Hitachi | Light-water (BWR) | 300 MWe | Under construction, Darlington (Canada) |
| VOYGR / US460 | NuScale | Light-water (PWR) | 77 MWe/module | US design approval; deployment pipeline |
| Natrium | TerraPower | Sodium fast reactor | 345 MWe | Under construction, Wyoming |
| Xe-100 | X-energy | High-temp gas (HTGR) | 80 MWe/module | Advanced licensing; Amazon-backed |
| KP-FHR | Kairos Power | Fluoride-salt HTR | 75 MWe | Demo under construction; Google-backed |
| SMR | Rolls-Royce | Light-water (PWR) | ~470 MWe | UK design assessment; site selection |
| Linglong One (ACP100) | CNNC | Light-water (PWR) | 125 MWe | Commissioning, China |
Source: company disclosures and World Nuclear Association, Small Nuclear Power Reactors , 2025–2026. Status is fast-moving; capacities are per module or per unit.
4. The companies & the value chain
4.1 The largest uranium companies
Uranium production is dominated by state-owned producers, and the way to size them up in an evergreen guide is by durable fundamentals — production, resources and cost — not market capitalisation or share price, which move daily and date a report instantly. By 2024 output the leaders are Kazakhstan’s Kazatomprom (the world’s largest and lowest-cost producer, almost all ISL), Canada’s Cameco (operator of the high-grade McArthur River and Cigar Lake mines and a fuel-cycle player), France’s Orano, China’s CGN and CNNC, Russia’s Uranium One and ARMZ (both Rosatom), Uzbekistan’s Navoi, and BHP, whose Olympic Dam yields uranium as a copper by-product. The listed pure-plays investors most often own — Cameco, Kazatomprom, Paladin, plus developers like NexGen and Denison — sit alongside these state giants.
Table 19. Leading uranium producers by output and resources, 2024
| Company | Country | Type | Listing | Mine output (tU) | Cost position |
|---|---|---|---|---|---|
| Kazatomprom | Kazakhstan | State, ISL | Public (LSE GDR: KAP; AIX); state ~75% | 12,463 | Lowest (ISL) |
| Cameco | Canada | Listed, conventional | Public (NYSE: CCJ; TSX: CCO) | 10,193 | Low (Athabasca grade) |
| Orano | France | State | State-owned (unlisted) | 6,815 | Mid |
| Uranium One | Russia | State (Rosatom) | State-owned (unlisted) | 5,829 | Low (ISL) |
| CGN | China | State | State parent; CGN Mining listed (HKEX: 1164) | 5,761 | Mid |
| Navoi | Uzbekistan | State, ISL | State-owned (unlisted) | 4,000 | Low (ISL) |
| CNNC | China | State | State-owned (listed arms exist) | 3,286 | Mid |
| ARMZ | Russia | State (Rosatom) | State-owned (unlisted) | 2,738 | Mid |
| BHP | Australia | By-product | Public (ASX: BHP; NYSE ADR) | 2,693 | By-product (copper-driven) |
Source: World Nuclear Association, uranium production by company , 2024; resources are large across all names but reported on very different bases (BHP’s Olympic Dam holds a vast low-grade by-product resource). Listing is the column to read first: only three of the nine — Cameco, Kazatomprom (GDR) and BHP — are practically investable for most readers, which is why the listed developers and physical trusts in Section 4.2 loom so large in uranium portfolios. No market-capitalisation figures are shown by design.
Figure 16. Leading uranium producers — output vs. resources, 2024
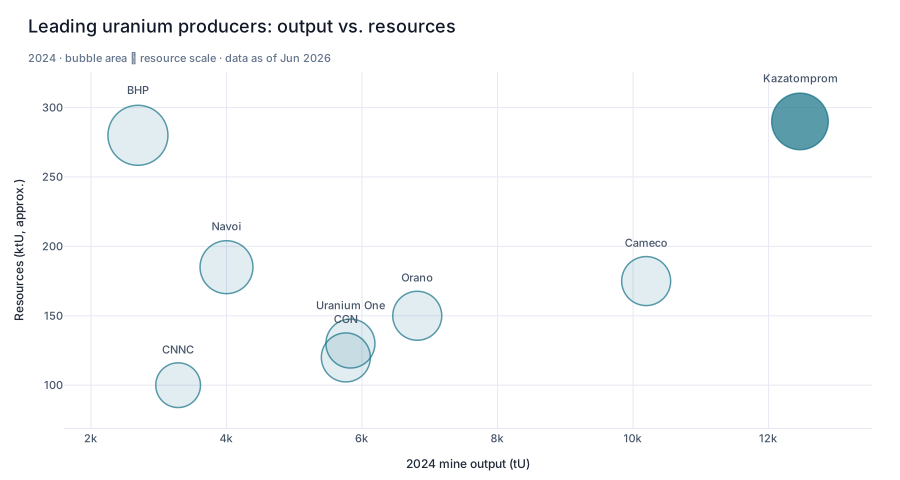
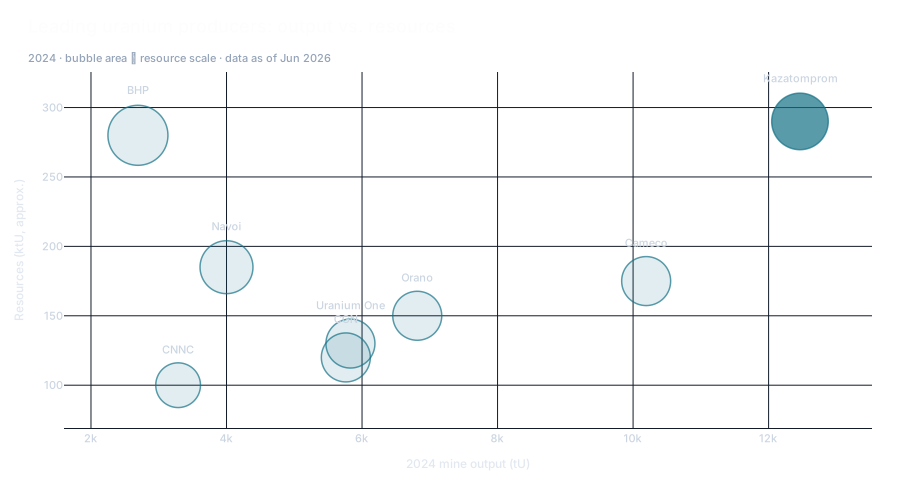
Figure data: Table 19.
4.2 Company archetypes along the value chain
Uranium exposure spans a wide risk/return spectrum, and an investor should match the archetype to the goal. Explorers (e.g. early-stage Athabasca names) offer pure option value with no cash flow. Developers and restart plays are permitting, building, or re-opening mines mothballed during the long bear market — high leverage to a rising price, value unlocked at first production. Pure-play producers (Kazatomprom, Cameco) mine and sell uranium with direct price exposure, set by their cost-curve position and their contract book. Physical-holding vehicles — the Sprott Physical Uranium Trust (SPUT) and Yellow Cake plc — simply hold pounds of U₃O₈, giving spot-price exposure with no operating risk, the uranium equivalent of a bullion ETF. Fuel-cycle companies (enrichers such as Centrus and Urenco; converters) earn service margins, and royalty vehicles finance miners for a slice of output.
Table 20. Uranium company archetypes
| Archetype | What they do | Revenue model | Price sensitivity |
|---|---|---|---|
| Explorer | Search for deposits | None (raise & spend) | Very high (sentiment) |
| Developer / restart | Build or re-open mines | None until production | High (operating leverage) |
| Pure-play producer | Mine & sell uranium | Uranium sales − cost | High |
| Physical holder (SPUT) | Hold pounds of U₃O₈ | None (price only) | 1:1 with spot |
| Fuel-cycle (enrich/convert) | Process uranium | Service fees ($/SWU) | Low (fee-based) |
| Royalty | Finance miners for a cut | Royalty income | Medium (capped cost) |
Source: company filings; the Metal Pilot project-type taxonomy, 2025.
Figure 17. Uranium company archetypes by price sensitivity
Source: company filings; conceptual, see Table 20.
4.3 Infrastructure & balance-sheet assets
What a uranium company owns — and how those assets are measured — determines what its filings are telling you. A producer’s balance sheet is built on its mineral resources and reserves (measured in tU or Mlb U₃O₈ and % U₃O₈ grade, valued via the net present value of the mine plan), its mines (ISL wellfields, or conventional pits/underground workings plus a mill, measured by capacity and recovery), and — for integrated players like Cameco — conversion and enrichment interests. A second, uranium-specific asset is the contract book: the portfolio of long-term sales contracts and the prices locked into them, which can matter more than the spot price for near-term cash flow. As with other miners, watch gross vs. net: many key assets (Cigar Lake, Inkai) are joint ventures, so the attributable share is what reaches shareholders.
Table 21. Uranium-company asset types and metrics
| Asset type | What it does | Key metric | Unit |
|---|---|---|---|
| Resources & reserves | The in-ground uranium base | Resource size; grade | tU / Mlb; % U₃O₈ |
| Mines (ISL / conventional) | Extract uranium | Capacity; recovery | tU/yr; % |
| Mill / processing | Produce yellowcake | Throughput | tU/yr |
| Conversion / enrichment | Fuel-cycle services | Capacity | tU/yr; SWU |
| Contract book | Locked-in sales | Contracted volume & price | Mlb; $/lb |
Source: company reserve statements (SEC S-K 1300 / NI 43-101) and annual reports, 2024; Metal Pilot project data.
5. Investing in uranium
5.1 Ways to own it — exposure vehicles
Uranium’s vehicle menu is unlike any other commodity’s, because you genuinely cannot store yellowcake in a vault of your own — only licensed facilities can hold it. The market’s answer is the physical trust: the Sprott Physical Uranium Trust (SPUT) and Yellow Cake plc buy and hold licensed pounds of U₃O₈, giving direct spot exposure with no operating risk — the uranium equivalent of a bullion ETF. But read the caveat before buying: a closed-end trust trades at a premium or discount to its net asset value, and both have swung wide. Buyers who paid a double-digit premium in hot markets have lost money to discount compression even while uranium itself rose — the uranium-specific analogue of the oil ETF’s roll drag. Check the premium/discount before every purchase; it is published daily. Beyond the trusts: futures (CME) exist but are thin — this is a contract market, not an exchange market; miner equities are the leveraged route, from Cameco and Kazatomprom through developers and restart plays to binary explorers (the archetypes of Section 4.2), with sector equity ETFs bundling them; and fuel-cycle names (enrichers, converters) offer fee-based exposure to the de-russification theme rather than to the uranium price itself.
Table 22. Ways to own uranium
| Vehicle | What you actually own | Tracks spot? | Key structural cost / risk | Best suited for |
|---|---|---|---|---|
| Physical trust (SPUT, Yellow Cake) | Licensed pounds of U₃O₈ | Yes — via NAV | Premium/discount to NAV swings | Direct exposure, patient capital |
| Futures (CME) | Exchange contracts | Yes, near-term | Thin liquidity; margin | Professionals |
| Producer equities | Mining businesses + contract books | No — amplifies | Hedged contract books cap rallies | Leverage to the price |
| Developer / restart equities | Projects awaiting the incentive price | No — amplifies more | Financing & execution risk | High-conviction leverage |
| Sector equity ETFs | A basket of the above | No — blended | Heavy single-name concentration | Diversified miner exposure |
| Fuel-cycle equities (enrichers) | SWU/conversion service margins | Weakly | Policy-driven, capacity-build risk | The de-russification theme |
Source: vehicle structures per trust and issuer documentation (Sprott, Yellow Cake) and CME contract specifications; structural attributes only — no fees, premiums or prices, which change daily.
5.2 How to value & screen uranium miners
The facts above turn into a repeatable checklist. For a producer, the metrics that matter are the resource and reserve base (how many pounds, at what grade — Athabasca’s ultra-high grades and Kazakh ISL’s low costs are the two ends of the quality spectrum), C1 cash cost and AISC per pound (who keeps mining through a downturn), and — uniquely for uranium — the contract book: how much output is sold forward and at what prices, since a producer fully committed at old low prices captures little of a rally. For developers and restarts, it is the project’s NPV and IRR at a conservative uranium price, the capital cost, and the incentive price needed to justify construction (a key uranium concept: the price that brings new supply on). For explorers, it is grade, drill results and jurisdiction.
The single most useful tool is the cost curve: rank world production from cheapest to most expensive, draw the prevailing price across it, and you can see who earns a fat margin and who needs a higher incentive price to exist at all — the gap that the bull thesis is built on. The same data lets you compare a producer’s valuation against its resources — the kind of screen (resource base, cost, contract cover) you can run across every uranium company on Metal Pilot.
Table 23. Uranium-miner screening metrics
| Metric | What it tells you | Good vs. concerning | Where to find it |
|---|---|---|---|
| Resources / grade | Scale and ore quality | Larger, higher-grade is better | Reserve statement |
| C1 / AISC ($/lb) | Cost competitiveness | Bottom-half of curve healthy | Annual report / MD&A |
| Contract book | Exposure to a rising price | Some uncommitted upside is better | MD&A / contract notes |
| Incentive price | Price needed for new supply | Below spot = buildable | Analyst / company guidance |
| Jurisdiction | Political & permitting risk | Tier-1 (Canada, Australia) safer | Country profile |
Source: company MD&A and reserve statements, 2024; cost-curve and incentive-price concepts per the Metal Pilot model reference.
Figure 18. Illustrative uranium cost curve (AISC vs. cumulative output)
Chart source: illustrative; AISC ranges from company MD&A, 2024, price line from Table 3. Stylised, not company-level data.
5.3 Macro regimes, rates & correlations
Uranium’s behaviour is the most idiosyncratic of any commodity in this series, and that is its defining investment feature. Because demand is inelastic and policy-driven rather than cyclical, uranium does not trade like “Dr. Copper ” or like an inflation hedge. (For how the major commodities compare across macro regimes — a framework uranium largely sits outside — see the macro regime guide .) Its price is driven by a chain of uranium-specific events — reactor build and retirement decisions, producer supply discipline, the slow drawdown of secondary supply, financial buying, and fuel-cycle geopolitics — that often have little to do with the broader economy. The result is long, self-reinforcing cycles: a decade-long bear after Fukushima, then a powerful bull from 2020.
The practical implication is low correlation to mainstream assets. Over 2000–2024, uranium’s relationship to broad equities, crude oil and copper has been weak and unstable, and its link to gold modest — it has been a genuine diversifier. The tightest relationships are with the things downstream of it: uranium-mining equities (which amplify the metal’s moves) and nuclear-policy sentiment. Interest rates and the dollar matter mainly at the margin (a weak dollar helps, as with any dollar-priced commodity), but uranium can rise in environments where most commodities fall, and vice versa. These relationships are sample-dependent and break down around shocks like Fukushima.
Table 24. Uranium across economic regimes
| Regime | Typical uranium behaviour | Why | Example |
|---|---|---|---|
| Nuclear-build optimism | Strong | Demand outlook lifts | 2005–2007; 2021–2024 |
| Post-accident / policy reversal | Very weak | Reactor shutdowns, glut | 2011–2016 (Fukushima) |
| Producer supply discipline | Strong | Mines idled, deficit | 2018–2021 |
| Financial (physical-trust) buying | Strong | Spot demand created | 2021 (SPUT launch) |
| Broad recession / risk-off | Largely independent | Fuel demand is inelastic | 2020 (brief dip, fast recovery) |
| Fuel-cycle supply shock | Strong | Russia de-risking, route risk | 2022–2024 |
Source: long-run spot series (UxC /TradeTech ) and nuclear-policy history; author analysis. Regime descriptions are historical, not predictive.
On past performance, uranium is a study in extremes: spot rose roughly 15-fold from its early-2000s lows to the 2007 peak, then fell ~70%; after Fukushima it ground down ~75% more into 2016; and from the 2016–2020 bottom it then roughly tripled into 2024. The drawdowns are deeper and longer than any base or precious metal here, and the recoveries faster — uranium is a high-volatility, feast-or-famine holding whose cycles are measured in years. Past performance is not indicative of future results.
The equity amplifier. The ≈ +0.8 correlation with the miners understates what leverage feels like in practice, in both directions. In the post-Fukushima bear, spot’s grind from ~$57 (2011 average) to ~$26 (2016) — about −55% on annual averages — became roughly −75% in Cameco and −90% or worse across the juniors, an entire cohort of which did not survive to the next cycle. In the recovery, annual-average spot rose from ~$30 (2020) to ~$84 (2024), not quite a 3×, while Cameco rose roughly six-fold from its 2020 low and quality developers re-rated by far more. Miners are the geared expression of the same thesis — and in uranium the gearing includes financing survival itself. (Data: UxC/TradeTech annual averages and NYSE/TSX price histories, 2011–2024 — concluded episodes.)
On correlations (monthly data, 2000–2024), uranium shows a low relationship with the S&P 500 (≈ +0.2), a low link to crude oil and copper (≈ +0.2), a modest link to gold (≈ +0.2 to +0.3), and a high correlation with uranium-mining equities (≈ +0.8, which is why miners are the leveraged way to play it). The dominant driver is not any macro variable but the nuclear fuel cycle itself. These are sample-dependent and unstable around shocks.
Table 25. Uranium correlations (monthly, 2000–2024)
| Asset | Correlation with uranium | Note |
|---|---|---|
| Uranium-mining equities | ≈ +0.8 (high) | The leveraged proxy |
| S&P 500 / global equities | ≈ +0.2 (low) | Largely independent |
| Crude oil | ≈ +0.2 (low) | Different drivers |
| Copper | ≈ +0.2 (low) | Not a growth-cycle metal |
| Gold | ≈ +0.2–0.3 (low-moderate) | Mild safe-haven overlap |
Source: author analysis of UxC /TradeTech spot and equity-index series, monthly, 2000–2024. Correlations are time-varying and can break down around shocks.
Figure 19. Uranium correlations, monthly 2000–2024
Figure data: Table 25.
5.4 Price drivers & cycles
Stripping out the noise, the uranium price is driven by a short list of forces — and the clearest evidence comes from concluded historical episodes, not live events. On the demand side: the reactor build-and-retirement pipeline, nuclear-policy shifts, and financial (physical-trust) buying. On the supply side: producer discipline (mines idled or restarted), the drawdown of finite secondary supply, and fuel-cycle geopolitics. The recurring pattern is a long lag between price and supply — mines take a decade to build and are slow to restart — which produces violent boom-bust cycles.
The settled case studies that illustrate the drivers: the 1970s producers’ cartel and a speculative bubble; the 2003–2007 boom that drove spot to ~$136/lb on a nuclear-renaissance narrative, then crashed; the March 2011 Fukushima accident, which triggered reactor shutdowns (Japan idled its entire fleet; Germany began phasing out) and a multi-year glut that bottomed near $18/lb in 2016; the 2017–2020 supply discipline as Cameco suspended McArthur River (2018) and Kazatomprom cut output, tightening the market; the 2021 launch of the Sprott trust, which converted investor demand into physical buying; and the 2023–2024 revival as the price broke $100/lb amid the Niger coup, Kazakh production shortfalls and the move to ban Russian fuel. Each is resolved history; the durable lesson is that uranium rallies when a growing reactor fleet meets a supply base that producers have spent years shrinking, and collapses when an accident or a glut destroys confidence.
Table 26. Uranium price drivers
| Driver | Direction of effect | Why | What to watch |
|---|---|---|---|
| Reactor build / retirement | More reactors → higher uranium | Sets long-run demand | Construction starts, restarts |
| Nuclear policy & sentiment | Pro-nuclear → higher | Drives the demand narrative | Government pledges, COP |
| Producer discipline | Cuts → higher | Mines idled tighten market | Kazatomprom / Cameco guidance |
| Secondary supply | Drawdown → higher | Finite buffer shrinking | Inventory & underfeeding data |
| Financial buying | Inflows → higher | Physical trusts absorb spot | SPUT / Yellow Cake holdings |
| Fuel-cycle geopolitics | Disruption → higher | Russia de-risking | Enrichment policy, sanctions |
Source: agency outlooks (WNA , OECD-NEA ) and long-run price history. Case studies are concluded historical episodes.
Those drivers resolve into a simple forward frame. It is not a forecast — uranium’s history warns against those — but a set of conditions and the price regime each would produce, bracketing the base case that the WNA outlook (Section 6) treats as most likely.
Table 27. Uranium price scenarios (illustrative, not forecasts)
| Scenario | Key conditions | Likely price regime |
|---|---|---|
| Bull | Reactor build-out accelerates (China, restarts, life-extensions, SMRs); secondary supply exhausts; mine restarts lag; Western de-russification bids up enrichment and HALEU | Sustained re-rating — spot presses toward and through prior-cycle highs |
| Base | The fleet grows on the WNA Reference path; mines, restarts and thinning secondary supply roughly keep pace | Firm and grinding higher — long-term contract prices lead spot up |
| Bear | A serious accident or policy reversal destroys demand, or new mine supply arrives faster than expected and financial buying reverses | Sharp, multi-year de-rating — a Fukushima-type break |
Source: author’s illustrative scenario frame, conditioned on the drivers in Table 26 and the WNA outlook in Section 6; the rows describe conditions and the regime they would produce, not forecasts.
5.5 Risks, controversies & ESG
The bull case has real counterweights, and uranium’s are unusually binary. The dominant risk is a nuclear accident: the concluded examples of Chernobyl (1986) and Fukushima (2011) each triggered policy reversals that crushed demand for years, and another serious accident anywhere could do the same. Policy reversal more broadly — Germany’s completed phase-out is the cautionary case — can remove demand at a stroke, while public opposition slows new build. Resource nationalism is acute in a market this concentrated: the 2023 Niger coup disrupted a major supplier, and Kazakhstan has raised mining taxes. And the market’s deepest structural risk is dependence on Russian enrichment, which the West is now scrambling, slowly and expensively, to replace.
On the non-financial side, uranium mining carries distinctive ESG exposure: the radioactivity of ore, waste rock and tailings; the groundwater risk of ISL operations; and, downstream, the unresolved question of long-term spent-fuel and high-level-waste disposal and the ever-present concern of weapons proliferation, policed by the IAEA. Set against that, nuclear’s defenders point to its status as the most energy-dense, low-carbon, always-on power source, with a tiny land and materials footprint per unit of energy and an excellent operational safety record per terawatt-hour. Substitution is real at the margin — renewables plus storage compete for new generation — but for an existing reactor, uranium is irreplaceable, which is what makes demand so inelastic. These are genuinely contested questions, and reasonable analysts weigh them very differently.
Figure 20. Uranium risk map — likelihood vs. impact
Source: author’s qualitative assessment; see Section 5.5.
6. Future outlook & forecasts
Uranium demand is unusually forecastable — it is set by the reactor fleet, which changes slowly and visibly — and the direction is firmly up, lifted by life-extensions, restarts, China’s build-out and the COP28 pledge to triple nuclear capacity by 2050. Forecasts remain scenarios, but the near-term ones are tightly anchored to plants already operating or under construction; the structural story is a supply pipeline that must be rebuilt to keep pace.
6.1 Demand
The World Nuclear Association (WNA), in its World Nuclear Fuel Report 2025, puts reactor uranium requirements at about 68,900 tU in 2025, rising ~26% to ~87,000 tU by 2030 and, in its Reference Scenario, to over 150,000 tU by 2040 — more than doubling in fifteen years (~5.3% a year). The range is wide: the Upper Scenario exceeds 204,000 tU and the Lower about 107,000 tU by 2040, reflecting how much hinges on build-out pace and reactor lifetimes. Underlying this, installed capacity is seen rising from ~398 GWe (2025) to ~746 GWe by 2040 in the Reference case — and the COP28 goal of tripling capacity by 2050 would need roughly a fourfold increase in annual production.
6.2 Supply and the gap
The catch is supply. Mine output covered about 90% of requirements in 2024 (~60,200 tU), with the rest met by thinning secondary supply — commercial and government inventories, re-enriched tails and ex-weapons material (Section 2.4). The WNA warns that several top mines deplete in the 2030s and that investment decisions are needed now: on current plans, supply from existing and committed mines peaks around 2030 and then declines, opening a widening gap against rising requirements from the mid-2030s. Closing it depends on new mines (with long lead times), restarts, and a rebuild of Western conversion and enrichment capacity to de-risk from Russia — while the secondary inventories that long plugged the gap keep shrinking.
Table 28. Uranium requirements, mine supply and the gap, 2025–2040 (tU/yr)
| Forecast (WNA Reference · scenario) | 2025 | 2030 | 2035 | 2040 |
|---|---|---|---|---|
| Reactor requirements | ~68,900 | ~87,000 | ~115,000 | >150,000 |
| Supply — existing & committed mines | ~61,000 | ~80,000 | ~72,000 | ~58,000 |
| Implied gap (met by secondary supply, then new mines) | ~8,000 | ~7,000 | ~43,000 | ~92,000 |
Source: WNA — World Nuclear Fuel Report 2025 , 2025. Reference scenario; 2035 interpolated; supply is existing and committed mines. Scenario projections, not measured data; tU = tonnes of uranium.
Figure 21. Uranium requirements vs. mine supply to 2040 (thousand tU)
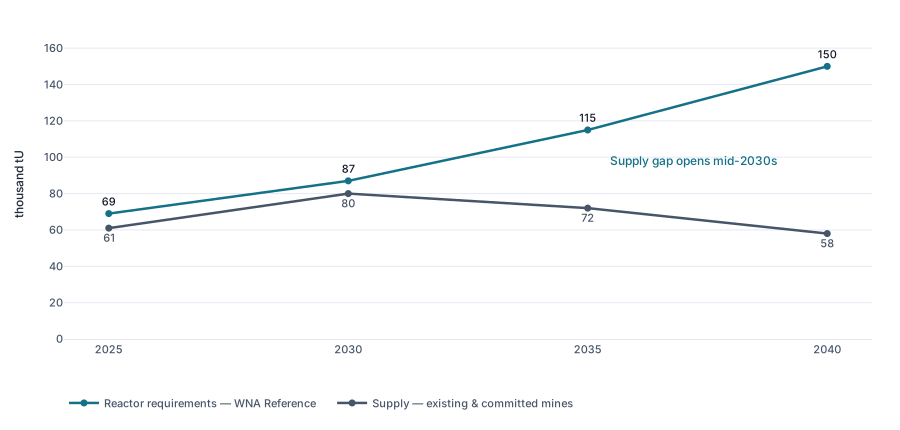
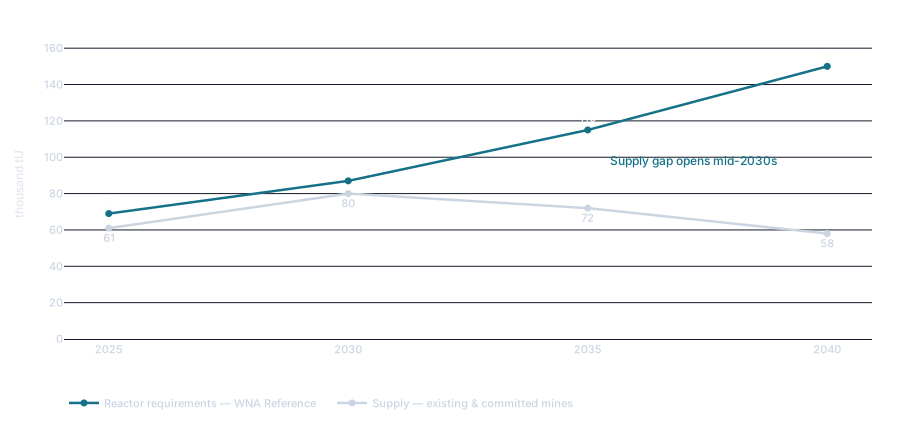
Source: WNA — World Nuclear Fuel Report 2025 , 2025. Requirements are the Reference scenario; supply is existing and committed mines. Scenario projection, not measured data.
6.3 Catalysts to watch
The forward watch-list is concrete. In the near term, the pace of Kazatomprom and Cameco production guidance (the swing supply), reactor restarts and life-extensions (Japan’s restarts, US plant restarts and uprates), financial-trust flows (SPUT and peers), and the rollout of Western enrichment capacity to replace Russian supply dominate. Over 3–10 years, the structural theme is the gap between a growing reactor fleet — China’s build-out, the COP pledge to triple nuclear capacity by 2050, and the wave of small modular reactors courted by technology firms for AI data centres — and a slow, concentrated mine-supply pipeline that must be rebuilt after a decade of under-investment. What would confirm the bull thesis: continued reactor build-out and a still-thin supply pipeline. What would break it: a serious nuclear accident, a major policy reversal, or faster-than-expected new mine supply.
Table 29. Uranium catalyst calendar
| Catalyst / theme | Timing | Why it matters | Watch |
|---|---|---|---|
| Kazatomprom / Cameco guidance | Quarterly | Swing supply | Production & sales updates |
| Reactor restarts & new build | Ongoing | Demand growth | Japan, China, SMRs |
| Western enrichment build-out | Multi-year | Russia de-risking | HALEU & SWU capacity |
| Physical-trust flows | Continuous | Spot demand | SPUT / Yellow Cake holdings |
| WNA Nuclear Fuel Report | Biennial | Supply-demand outlook | world-nuclear.org |
| OECD-NEA Red Book | Biennial | Resource & production update | oecd-nea.org |
Source: WNA , OECD-NEA and company guidance calendars.
7. Summary
Uranium is the fuel of nuclear power, and its market is unlike any other metal. Physically it is the most energy-dense fuel we use, valued solely as reactor fuel (~99% of demand), so its price is set not on an exchange floor but through spot and long-term contracts reported by UxC and TradeTech — and read best as a multi-year average, which collapsed from a ~$99 spot average in 2007 to ~$26 in 2016 before recovering to ~$84 in 2024 and ~$74 in 2025. It is mined in a few places — Kazakhstan (~39%), Canada and Namibia lead, and the top five are ~88% of supply — and turned into fuel through a long fuel cycle whose strategic choke point is enrichment, where Russia holds ~40% of capacity. Demand comes from ~440 reactors needing ~69,000 tU a year, led by the United States and a fast-rising China that is building most of the world’s new reactors. The market runs a structural primary deficit: mines cover only ~90% of demand, with finite secondary supply filling the gap — a setup that tightens as the fleet grows. The companies that mine it — Kazatomprom, Cameco, Orano, CGN and peers, mostly state-owned — are best compared on production, resources and cost, never on a fast-moving market cap, and they span everything from binary explorers to physical-holding trusts. Uranium’s regime is idiosyncratic: it ignores the business cycle and instead rewards reactor build-out, producer discipline and fuel-cycle stress, while collapsing after accidents — with deep, multi-year boom-bust swings. The single most important variable to watch is the gap between a growing reactor fleet and a slow, concentrated supply pipeline.
To go from this big-picture view to the actual companies — screening every uranium producer by resources, cost and contract cover — explore Metal Pilot.
8. Vocabulary
Every specialised term used in this report, defined once at first use in the body, collected here for reference.
Table 30. Uranium vocabulary
| Term | Plain-language definition | Why it matters to an investor |
|---|---|---|
| U-235 / U-238 | The fissile (0.7%) and fertile (99.3%) isotopes | Why uranium must be enriched |
| Grade (% U₃O₈) | Uranium content of ore | Decides what is economic; Athabasca is world-class |
| Yellowcake (U₃O₈) | Uranium oxide concentrate | The form bought, sold and priced |
| Conventional mining | Open-pit / underground + mill | One of two main supply routes |
| In-situ leach (ISL/ISR) | Dissolve uranium underground | Now >50% of supply; low-cost (Kazakhstan) |
| Conversion (UF₆) | Yellowcake to uranium hexafluoride gas | A separately-priced fuel-cycle step |
| Enrichment | Raising U-235 to 3–5% | The strategic choke point (Russia ~40%) |
| SWU | Separative work unit | The unit (and price) of enrichment effort |
| Tails / underfeeding | Depleted uranium left from enrichment | Can be re-enriched to add “secondary” supply |
| Fuel fabrication | Pellets & assemblies for a reactor | The last step before the reactor |
| Secondary supply | Inventories, ex-weapons, underfeeding | Fills the gap between mines and demand |
| HEU downblending | Diluting weapons uranium to fuel | The “Megatons to Megawatts” legacy supply |
| Reprocessing / MOX | Recycling spent fuel into new fuel | Limited; small share of supply |
| Reactor requirements | Annual uranium a fleet needs | The core demand number (~69,000 tU) |
| Spot vs. term price | One-off vs. multi-year contract | Most volume trades on term contracts |
| Resources (RAR + inferred) | Economically recoverable endowment | Uranium’s “reserve” equivalent |
| C1 / AISC | Cash and all-in sustaining cost per lb | Who survives a downturn |
| By-product | Uranium from a copper/gold mine | Inelastic to the uranium price |
| Sprott / SPUT | Physical uranium holding trust | Turns investor demand into spot demand |
| SMR | Small modular reactor | A key forward demand theme |
Source: definitions follow the World Nuclear Association and OECD-NEA glossaries and SEC S-K 1300 / NI 43-101 resource standards, 2025.
9. Sources, methodology & disclaimer
9.1 Sources, methodology & data vintage
Agencies & official data: World Nuclear Association — Uranium Production by Country ; WNA — World Uranium Mining Production ; WNA — World Nuclear Power Reactors & Uranium Requirements ; WNA — Uranium Enrichment ; OECD-NEA & IAEA, Uranium 2024 (“Red Book”) ; IAEA .
Prices & markets: UxC Nuclear Fuel Price Indicators ; TradeTech ; Cameco uranium price ; UN Comtrade for trade flows.
Company filings: annual reports and technical reports (SEC S-K 1300 / NI 43-101) and the WNA uranium-production-by-company table for Kazatomprom, Cameco, Orano, CGN, CNNC, Uranium One, Navoi and BHP, 2024.
Methodology: prices are calendar-year averages of spot U₃O₈ (UxC/TradeTech industry estimates), never spot snapshots; most uranium actually trades on long-term contracts at different prices. Production and reactor requirements follow the WNA; resources follow the OECD-NEA/IAEA Red Book (reasonably assured plus inferred, to $130/kgU). Regional demand splits, enrichment shares and company resources are approximate and reported on differing bases — each figure is attributed to its source. Correlations use monthly data over 2000–2024 and are historical. Resources and forecasts are estimates, not measured facts.
Data as of: 2 July 2026. Intended update cadence: as the WNA production and reactor tables are revised (roughly every two months), and after each biennial WNA Nuclear Fuel Report and OECD-NEA/IAEA Red Book.
9.2 Disclaimer & disclosure
This report is for informational purposes only and is not investment advice, a recommendation, or an offer to buy or sell any security or commodity. Uranium prices are volatile, and the figures here are estimates as of the stated date that will change; resources, correlations and regime descriptions are estimates and historical observations that may not persist. Do your own research and consult a licensed financial adviser before acting. This report was prepared with the assistance of AI; its figures were sourced from the references above and reviewed, but readers should verify any number before relying on it. The author holds no position disclosed as a conflict in respect of the companies named.