

Copper — A Complete Market Guide (2026)
Data as of 26 June 2026. Prices are quoted as multi-year and full-year averages, not a single day’s snapshot, so this report stays useful over time. Reserves, production splits, balances, and historical series are estimates from agency data, rounded for clarity. This report is for information only and was prepared with AI assistance — see the disclaimer at the end.
Copper is the metal the modern economy is wired with, and the one the energy transition cannot do without — every electric motor, grid cable, data-centre and solar farm runs on it. In 2024–2025 copper repeatedly set record highs as electrification demand collided with a mine-supply base that is getting harder and more expensive to grow. This report is the free, big-picture primer on how the copper market actually works — where it comes from, who smelts and buys it, how its price is set, and which economic regimes favour it. For the company-level data behind the charts — every producer screened by production, reserves and cost — go to Metal Pilot.
TL;DR & Key Takeaways
- What it is: the cheapest highly-conductive industrial metal, indispensable for electricity and heat transfer. Unlike gold, copper is consumed in use (locked into buildings, cables and machines for decades), so the market is driven by industrial flow, not by an above-ground hoard.
- Market structure: mine supply (~23 Mt/yr) is concentrated in the Andes — Chile and Peru alone are ~35% of output — while China controls roughly half of all smelting and refining and consumes ~58% of refined copper. There is no producer cartel; the price is set on the LME, COMEX and Shanghai exchanges.
- Demand story: copper demand tracks global growth and, increasingly, electrification — grids, electric vehicles, renewables and data centres — layered on top of construction and traditional industry. This is why traders call it “Dr. Copper”, the metal with a PhD in economics.
- Price regime: copper is a pro-cyclical, dollar-priced industrial metal. It does best in global expansions, early-cycle recoveries and a weak dollar, and worst in recessions and China slowdowns. Recycling (~a third of supply) cushions, but cannot replace, mine output.
- Biggest swing factor: the pace of global industrial growth and electrification demand against a constrained, long-lead-time mine-supply pipeline.
Numbers to remember (copper at a glance)
Figure 1. Copper at a glance
Figure data: USGS Mineral Commodity Summaries 2026 and ICSG; see Sections 2.1–2.6.
Why it matters now: copper is the physical bottleneck of the energy transition. Demand from grids, EVs and data centres is rising structurally just as new mines take longer to permit and ore grades fall — a setup that keeps the market tight. The big-picture case is below.
How to read this guide: new to copper? Read straight through from Section 1. Here for the investment case? Jump to Section 4 — how to own it, how to screen the miners, and which regimes favour the metal. Every technical term is defined in the Vocabulary (Section 7).
1. Copper & the market basics
1.1 What copper is — physical basics & quality
Copper (chemical symbol Cu) is a reddish, ductile metal valued for one property above all: after silver, it is the best everyday conductor of electricity and heat — and it is far cheaper and more abundant than silver. That single fact makes it the default material for anything that carries current or moves heat: power cables, motor windings, transformers, wiring, heat exchangers and printed circuits. It is also corrosion-resistant, easily alloyed (into brass and bronze) and infinitely recyclable without loss of quality. Copper earns its value as a pure industrial input: there is no monetary or jewellery pillar of the kind that supports gold, so demand rises and falls with the real economy — construction, manufacturing, the electricity grid and, increasingly, the clean-energy build-out.
A few terms define copper quality and form, each used throughout this report:
- Ore grade — the percentage of copper in mined rock, expressed as % Cu. Grades have fallen for decades; a modern open-pit porphyry mine may run just 0.4–0.6% Cu, so hundreds of tonnes of rock are moved per tonne of metal. Grade, more than the copper price alone, decides whether a deposit is economic.
- Oxide vs. sulfide ore — the two main ore types, which require different processing. Sulfide ores (the bulk of supply) are concentrated by flotation then smelted; oxide ores are leached and processed directly to metal by the SX-EW route (see below). The oxide → SX-EW route is the cheaper to process: by making cathode on-site it skips smelting, refining and the treatment & refining charges (TC/RCs) they levy, and it draws far less energy — on the order of 15–36 MJ per kg of copper versus ~65 MJ/kg for the conventional smelting route, roughly half or less (Copper Development Association ). The catch is that it only works on oxide ores, which are lower-grade and steadily depleting, so sulfides still dominate supply. Define once: conventional copper here means sulfide ore taken through concentrate, smelting and refining.
- Concentrate — the ~25–30% Cu powder produced by milling and flotation at the mine; concentrate is shipped to a smelter to be turned into metal.
- Cathode — the final product, a 99.99% pure sheet of refined copper (LME “Grade A”). Everything in the price world is quoted for cathode.
- Primary vs. by-product — copper mined for its own sake (primary) versus copper recovered alongside gold, molybdenum or other metals; conversely, gold, silver and molybdenum are common by-product credits that lower a copper mine’s cost (see Section 2.5).
The value chain — from ground to grid. Sulfide copper moves along one main path: exploration → mining → milling & flotation (concentrate) → smelting (blister/anode) → electro-refining (99.99% cathode) → fabrication (wire rod, tube, sheet) → the end buyer (construction, grids, transport, industry). A shorter SX-EW path (solvent extraction–electrowinning) leaches oxide ore straight to cathode, skipping the smelter. The single concentrated choke point is smelting and refining, where roughly half of world capacity now sits in China.
Figure 2. The copper value chain, ground to grid
Source: industry value-chain primers; conceptual diagram.
From rock to cathode — the two processing routes. How copper ore becomes metal depends on the ore type. For sulfide ores — the bulk of supply — the rock is first crushed, then ground in a mill (a SAG mill followed by ball mills) to a fine powder that frees the copper-bearing mineral grains. Those grains are separated from the worthless rock by froth flotation: the slurry is aerated with reagents that make the copper minerals water-repellent, so they cling to rising bubbles and are skimmed off as a concentrate (~25–30% Cu) while the gangue sinks. The concentrate goes to a smelter, which melts it at high temperature to burn off iron and sulfur and pour blister/anode copper (~99%); that anode is then electro-refined — dissolved in an acid bath and re-plated as a 99.99% pure cathode, with the gold, silver and other impurities dropping out as valuable anode slime. The shorter SX-EW route handles oxide ores chemically and skips the furnace: the ore is heap-leached with dilute sulfuric acid, the copper is purified by solvent extraction (SX), then plated out directly as cathode by electrowinning (EW). So sulfide ore travels concentrate → smelter → refinery, while oxide ore goes leach → SX → EW straight to the same cathode.
1.2 Units & measurement conventions
This report uses the base-metals convention throughout, stated here so every later number is unambiguous. Copper quantities are measured in metric tonnes (t), thousand tonnes (kt) and million tonnes (Mt) of contained or refined copper, mirroring the convention used by the U.S. Geological Survey (USGS) and the International Copper Study Group (ICSG). Price is quoted two ways that the reader must be able to convert between: US dollars per tonne (USD/t) on the London Metal Exchange (LME), and US cents per pound (¢/lb) on COMEX and in U.S. industry data. The conversion is fixed: 1 tonne = 2,204.62 lb, so $9,000/t ≈ 408¢/lb and 400¢/lb ≈ $8,818/t. Ore grade is % Cu; concentrate grade is also % Cu (~25–30%); cathode purity is 99.99%.
Crucially, copper figures split into flow and stock, and the two must not be confused:
- Flow — quantities per year: mine production (~23 Mt/yr), refined production (~27.6 Mt/yr), refined usage (~27 Mt/yr), recycling (~a third of supply).
- Stock — a level at a point in time: reserves (the economically mineable subset of resources, ~980 Mt), exchange inventories (the visible metal in LME/COMEX/SHFE warehouses, which swing the short-term price), and the vast in-use stock of copper already installed in buildings, cables and equipment, which becomes tomorrow’s scrap.
Table 1. Copper units and conversions
| Unit | Meaning | Typical magnitude in copper | Conversion |
|---|---|---|---|
| tonne (t) | Metric tonne, copper content | A car ≈ 25 kg; a wind turbine ≈ 4 t | 2,204.62 lb |
| kt | Thousand tonnes | Single-mine annual output | 1,000 t |
| Mt | Million tonnes | National & global flows; reserves | 1,000 kt |
| USD/t | Dollars per tonne | LME benchmark quote | ÷ 22.046 = ¢/lb |
| ¢/lb | US cents per pound | COMEX & U.S. data | × 22.046 = USD/t |
| % Cu | Copper grade | Ore ~0.5%; concentrate ~28%; cathode 99.99% | — |
Source: USGS Copper Statistics and Information , 2026; LME copper contract specifications , 2025.
Numbers intuition: a large modern copper mine produces 200–1,200 kt/yr of contained copper; the world’s biggest single mine, Escondida in Chile, can exceed 1,000 kt/yr. Total annual mine supply (~23 Mt) is worth roughly $220 billion at recent prices — a far larger industrial market than gold’s mine output, though copper is worth only about $9,500 per tonne versus gold’s roughly $110 million per tonne (see the gold guide ).
1.3 Pricing & benchmarks
There is no single “copper price”; there are three linked exchange benchmarks, and the rule in this report is to quote averages, not a single day’s snapshot. The global reference is the LME Grade A copper contract (London), quoted in USD/t and used to price physical cathode worldwide. COMEX (CME Group, New York) trades a high-grade contract in ¢/lb and is where much speculative positioning sits; in 2025 COMEX traded at an unusual premium to the LME because of U.S. tariff uncertainty on copper imports. The Shanghai Futures Exchange (SHFE) reflects Chinese physical demand and, like the Shanghai gold premium, signals how tight the Chinese market is. On top of the exchange price, physical buyers pay a cathode premium (e.g. the CME/Yangshan premium) for delivery to a specific location.
Because cathode is a standardised, globally arbitraged product, regional differences are premiums and discounts rather than the large quality differentials seen in oil. A second commercial price matters upstream: treatment and refining charges (TC/RCs) — the fee miners pay smelters to turn concentrate into metal. TC/RCs fall when concentrate is scarce relative to smelter capacity, so a collapse toward zero (as in 2024–2025) is a clear signal of a tight concentrate market and over-built (largely Chinese) smelting. Copper usually trades in mild contango (futures above spot) reflecting carry, flipping to backwardation when nearby metal is scarce.
Table 2. Key copper benchmarks
| Benchmark | What it prices | Pricing point | Role |
|---|---|---|---|
| LME Grade A (cash/3-month) | 99.99% cathode | London | Global reference; physical settlement |
| COMEX high-grade (HG) | Exchange futures | CME, New York | Price discovery, positioning, U.S. price |
| SHFE copper | Cathode in China | Shanghai | Chinese demand signal (premium/discount) |
| TC/RCs | Smelting/refining fee | Annual & spot, concentrate | Tightness of the concentrate market |
Source: LME , 2025; CME Group / COMEX , 2025; SHFE , 2025.
The long-run price story is one of a structural step-change driven by China. After two decades near $1,500–3,000/t, copper was swept up in the 2003–2008 China “supercycle”, crashed in the global financial crisis, then peaked above $10,000/t in 2011. A 2011–2016 bear market followed as supply caught up and Chinese growth cooled, before electrification demand drove a second leg: copper averaged $9,142/t in 2024 and ~$9,947/t in 2025 (IMF/LME annual averages), repeatedly setting fresh records above $10,000–11,000/t intraday. The 2000–2025 series below carries the whole arc — the supercycle, the crash, the long bear and the electrification era.
Table 3. Average annual copper price, 2000–2025 (USD/t, LME/IMF annual averages)
| Year | 2000 | 2001 | 2002 | 2003 | 2004 | 2005 | 2006 | 2007 | 2008 | 2009 | 2010 | 2011 | 2012 |
|---|---|---|---|---|---|---|---|---|---|---|---|---|---|
| Price | 1,813 | 1,578 | 1,559 | 1,779 | 2,865 | 3,678 | 6,722 | 7,118 | 6,952 | 5,150 | 7,534 | 8,821 | 7,950 |
| Year | 2013 | 2014 | 2015 | 2016 | 2017 | 2018 | 2019 | 2020 | 2021 | 2022 | 2023 | 2024 | 2025 |
|---|---|---|---|---|---|---|---|---|---|---|---|---|---|
| Price | 7,325 | 6,861 | 5,510 | 4,868 | 6,170 | 6,530 | 6,010 | 6,175 | 9,317 | 8,829 | 8,491 | 9,142 | 9,947 |
Source: IMF Primary Commodity Prices / Global price of Copper (LME) , 2000–2025. Figures are calendar-year averages, not spot, rounded.
2. Supply, demand & the market balance
2.1 Where copper is mined — deposits & geology
Copper supply is far more geographically concentrated than gold’s, because the richest deposits sit in a few specific geological belts. Roughly 80% of the world’s copper comes from porphyry copper deposits — large, low-grade bodies formed where magma intruded the crust along ancient and modern subduction zones. The defining belt is the Andes: the Atacama region of northern Chile and southern Peru hosts the greatest concentration of copper on Earth, including Escondida, Collahuasi, El Teniente and Cerro Verde. Other major sources are the Central African Copperbelt (the Democratic Republic of the Congo and Zambia, higher-grade sediment-hosted deposits, often with cobalt), the porphyries of the U.S. Southwest (Arizona), Indonesia and Mongolia (copper-gold porphyries like Grasberg and Oyu Tolgoi), and sediment-hosted deposits in Poland and Kazakhstan.
In 2025 Chile, the DRC, Peru, China and Russia led output and together accounted for about 62% of global mine production — far more concentrated than gold. Chile alone is ~23% of world supply, and the Andes (Chile + Peru) about 35%. The fastest-growing source is the DRC, where the giant Kamoa-Kakula complex has pushed the country past Peru into second place.
Table 4. Leading copper-mining countries, 2025 (estimated)
| Rank | Country | Mine output (kt) | Share of world | Trend |
|---|---|---|---|---|
| 1 | Chile | 5,300 | 23% | Flat/recovering |
| 2 | Congo (Kinshasa) | 3,200 | 14% | Rising fast |
| 3 | Peru | 2,700 | 12% | Flat |
| 4 | China | 1,800 | 8% | Flat |
| 5 | Russia | 1,300 | 6% | Rising |
| 6 | United States | 1,000 | 4% | Declining |
| 7 | Zambia | 940 | 4% | Rising |
| 8 | Australia | 730 | 3% | Flat |
| 9 | Indonesia | 710 | 3% | Variable (grade) |
| 10 | Kazakhstan | 710 | 3% | Flat |
| — | Rest of world | 4,610 | 20% | — |
| — | World total | 23,000 | 100% | Slightly up |
Source: USGS Mineral Commodity Summaries 2026: Copper , February 2026. Figures rounded; shares are approximate.
Figure 3. Leading copper-mining countries, 2025 (kt)
Figure data: Table 4.
Copper is even more concentrated at the asset level: the ten mines below produce roughly a quarter of the world’s copper, and a strike, a court ruling or a water shortage at any one of them moves the global balance — the 2023 shutdown of Cobre Panamá (~350 kt) demonstrated exactly that (Section 4.5).
Table 5. Largest copper mines, 2024 (approximate output)
| Mine | Country | Operator / owners | Output (kt Cu, ≈) | Note |
|---|---|---|---|---|
| Escondida | Chile | BHP (57.5%) / Rio Tinto | ~1,280 | Largest copper mine on Earth |
| Grasberg | Indonesia | Freeport-McMoRan / MIND ID | ~815 | Copper-gold porphyry, block cave |
| Collahuasi | Chile | Anglo American / Glencore | ~560 | High-grade Andean porphyry |
| Tenke-Fungurume | DR Congo | CMOC | ~450 | Copper-cobalt, Central African Copperbelt |
| Kamoa-Kakula | DR Congo | Ivanhoe Mines / Zijin | ~440 | Fastest-growing major mine |
| Cerro Verde | Peru | Freeport-McMoRan | ~430 | One of the world’s largest concentrators |
| Antamina | Peru | BHP / Glencore | ~410 | Copper-zinc |
| Morenci | United States | Freeport-McMoRan | ~400 | Largest US copper mine |
| Buenavista | Mexico | Southern Copper | ~380 | SX-EW plus concentrator |
| El Teniente | Chile | Codelco | ~360 | Largest underground copper mine |
Source: company annual reports and production statements, full-year 2024. Mine-level output on a 100% basis; figures approximate and rounded. Screen every producing asset on Metal Pilot.
2.2 Demand & consumption
Copper demand is, in the end, a bet on industrial growth and electrification. World refined copper usage reached roughly 27 Mt in 2024, an all-time high, and the long-run trend is firmly upward as economies build out grids and electrify transport. The four broad demand pillars are construction, the electrical network, equipment/manufacturing and transport — with the energy transition cutting across all of them.
Over time the climb has been steady rather than spectacular: refined usage rose about 80% — from ~15 Mt in 2000 to ~27 Mt in 2024, or roughly 2–2.5% a year — broadly in step with the parallel growth in mine supply (Section 2.3). The year-to-year change is cyclical, though: flat-to-negative in downturns (2009, 2020) and mid-single-digit in expansions, which is why copper reads as a barometer of the industrial cycle.
By end use, the International Copper Study Group (ICSG) splits global copper into roughly equipment ~32% (electrical and electronic goods, appliances), building construction ~26% (wiring, plumbing, roofing), infrastructure ~17% (power transmission, distribution and telecoms), transport ~13% (vehicles, rising fast with EVs) and industrial machinery ~12%. The structural growth is in the electrical end: an electric vehicle uses roughly three to four times the copper of a combustion car, and grids, solar, wind and data centres are all copper-intensive. The International Energy Agency expects clean-energy uses to take a sharply rising share of copper demand through 2040.
Table 6. Global copper demand by end use, 2024 (share of consumption)
| End use | Share | Note |
|---|---|---|
| Equipment (electrical & electronic) | 32% | Appliances, motors, electronics |
| Building construction | 26% | Wiring, plumbing, roofing |
| Infrastructure | 17% | Grids, transmission, telecoms |
| Transport | 13% | Vehicles; rising with EVs |
| Industrial machinery | 12% | Capital goods, heat exchangers |
Source: ICSG end-use of copper and The World Copper Factbook 2024 , ICSG; shares are approximate and based on copper semis end-use.
Figure 4. Global copper demand by end use, 2024
Figure data: Table 6.
Geographically, copper demand is dominated by one country to a degree no other major commodity matches: China consumes about 58% of the world’s refined copper, the legacy of two decades of construction, manufacturing and, now, grid and EV build-out. The rest is spread across the United States, Germany, Japan, South Korea and India, with India the fastest-growing large consumer. The shift since 2000 is dramatic: China’s share rose from roughly 12% to ~58%, while Europe’s and North America’s shares fell even as their absolute usage held broadly flat.
Table 7. Refined copper usage by region, selected years (kt)
| Region | 2000 | 2010 | 2020 | 2024 |
|---|---|---|---|---|
| China | 1,900 | 7,400 | 13,800 | 15,800 |
| Other Asia | 4,500 | 4,000 | 3,900 | 4,100 |
| Europe | 4,300 | 4,200 | 3,300 | 3,300 |
| Americas | 3,500 | 2,700 | 2,300 | 2,300 |
| Rest of world | 1,000 | 1,100 | 1,700 | 1,800 |
| Total usage | ~15,200 | ~19,400 | ~25,000 | ~27,300 |
Source: ICSG World Copper Factbook and statistical releases , 2000–2024; regional splits are approximate. China is split out as its own category given its ~58% share of world usage — the remaining rows follow broader regional groupings than the standard EI set for the same reason.
Figure 5. Refined copper usage by region, 2000–2024 (kt)
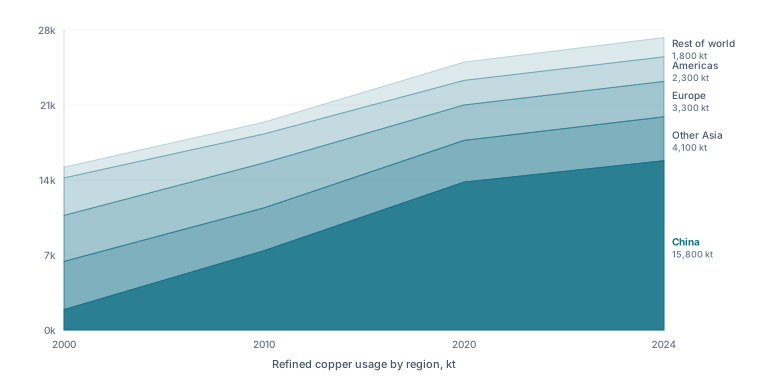
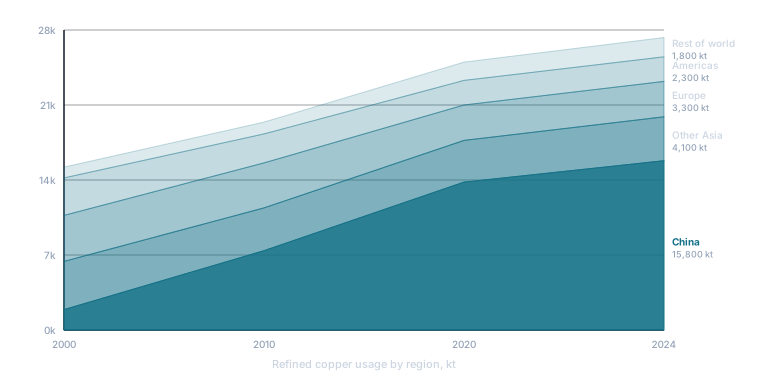
Figure data: Table 7.
2.3 Supply: producing countries
Annual copper supply has two sources — newly mined metal and recycled scrap (Section 2.5) — and a critical second stage, smelting and refining, that is geographically separate from mining. World mine production has grown by roughly three-quarters since 2000, from ~13 Mt to ~23 Mt (the multi-year forward projection is in Section 5), but growth has slowed as ore grades fall, new discoveries thin out and the best deposits sit in jurisdictions with rising political and water risk. National output is led by Chile, the DRC and Peru, with state influence meaningful in Chile (Codelco) and the DRC, and largely private/listed production elsewhere.
Table 8. World copper mine production, selected years (kt)
| Year | 2000 | 2005 | 2010 | 2015 | 2020 | 2023 | 2024 | 2025e |
|---|---|---|---|---|---|---|---|---|
| Mine production | 13,200 | 15,000 | 16,100 | 19,100 | 20,600 | 22,400 | 23,000 | 23,000 |
Source: USGS Mineral Commodity Summaries , copper chapters 2001–2026. Figures rounded.
The refining picture tells a different, more concentrated story: China alone produces around 14 Mt of refined copper a year — roughly half the world total of ~28 Mt — even though it mines only ~8% of the ore. China has built smelting capacity far faster than its own mines can feed, which is why it is the dominant importer of concentrate and the price-setter in the concentrate (TC/RC) market. Reserves, the longevity story, again favour the Andes: Chile holds ~180 Mt of the world’s ~980 Mt, followed by Peru, Australia, Russia and the DRC. At ~23 Mt of annual mine supply, global reserves imply a reserve life of roughly 43 years — though resources are far larger (the USGS puts identified resources at ~1.5 billion tonnes of unextracted copper, or ~2.1 billion including cumulative past production).
Figure 6. Refined copper production by country, 2025 (kt)
Source: USGS Mineral Commodity Summaries 2026: Copper , 2026 (refinery production).
Table 9. Top copper reserves by country, 2025 (Mt of contained copper)
| Country | Reserves (Mt) | Country | Reserves (Mt) |
|---|---|---|---|
| Chile | 180 | United States | 47 |
| Australia | 100 | China | 41 |
| Peru | 85 | Poland | 33 |
| Russia | 80 | Zambia | 21 |
| Congo (Kinshasa) | 80 | Indonesia | 21 |
| Mexico | 53 | Kazakhstan | 20 |
| World total | ~980 |
Source: USGS Mineral Commodity Summaries 2026: Copper , February 2026. Reserves are economically mineable; resources are far larger.
2.4 The supply–demand balance
Unlike gold, copper is genuinely consumed, so its balance behaves like an industrial commodity: when refined supply exceeds usage the market runs a surplus and exchange inventories build; when usage outruns supply it runs a deficit and stocks draw down, pushing the price up. The series below shows how finely poised that balance is — the swings are measured in hundreds of kilotonnes against a ~26,000 kt market, rarely as much as ±2% of demand, which is precisely why prices react so violently to small surprises. After a long run of deficits through 2022, new mine and smelter capacity tipped the market into a slim surplus in 2024–25, with the ICSG and most analysts expecting a return to deficit from ~2026 as demand outpaces a thin mine-supply pipeline. The multi-year outlook — and the structural gap most analysts expect to open this decade — is detailed in Section 5.
Table 10. Refined copper market balance, 2015–2025 (kt)
| Year | 2015 | 2016 | 2017 | 2018 | 2019 | 2020 | 2021 | 2022 | 2023 | 2024 | 2025e |
|---|---|---|---|---|---|---|---|---|---|---|---|
| Balance (kt) | −150 | −100 | −250 | −400 | −400 | −500 | −450 | −400 | −50 | +300 | +250 |
Source: ICSG press releases and Copper Market Forecast , apparent refined balance (production − usage), 2015–2025; figures approximate, rounded to the nearest 50 kt and subject to ICSG revision — the magnitude (under ±2% of usage), not the precise number, is the point.
Figure 7. Refined copper market balance, 2015–2025
Figure data: Table 10.
The shock absorber between balance and price is visible inventory: the metal sitting in LME, SHFE and COMEX warehouses. Those exchange stocks have oscillated between very roughly 300 and 900 kt in recent years — sounds like a lot, until you divide by ~27 Mt of annual usage: the world’s visible copper stocks cover only one to two weeks of demand. That razor-thin buffer is why inventory data moves the price week to week (Section 4.4) and why a single mine outage can flip sentiment.
At the country level, the meaningful split is between net-mining nations (Chile, Peru, the DRC, which mine far more than they consume and export concentrate or cathode) and the dominant net importer, China, which both refines and consumes more than any other country and pulls in concentrate, refined metal and scrap from the rest of the world. This single asymmetry — Andean and African supply flowing to Chinese demand — defines the copper trade map (Section 2.6).
Table 11. Copper net positions, major countries, 2024 (kt, mine output vs. refined usage)
| Country | Mine output | Refined usage | Net position |
|---|---|---|---|
| Chile | 5,510 | ~310 | +5,200 (net exporter) |
| Peru | 2,740 | ~230 | +2,510 (net exporter) |
| Congo (Kinshasa) | 2,990 | ~60 | +2,930 (net exporter) |
| United States | 1,050 | ~1,700 | −650 (net importer) |
| China | 1,840 | ~15,800 | −13,960 (net importer) |
Source: mine output from USGS , 2026; refined usage approximated from ICSG , 2024. Figures approximate; the China gap is met by imported concentrate, refined metal and scrap.
Figure 8. Copper net positions, major countries, 2024 (kt)
Figure data: Table 11.
2.5 Supply structure: primary, by-product & recycling
Copper supply is overwhelmingly primary-mined, but with two features that shape its price behaviour. First, a meaningful slice of copper is a co-product or by-product: many copper mines also produce gold, silver and molybdenum, whose sale as by-product credits can lower the copper mine’s reported cost dramatically — and, conversely, some copper comes out of mines run primarily for other metals. Second, and more important, copper has a large and growing recycling layer. According to the International Copper Association, recycled copper meets about 32% of total copper demand (counting both directly re-melted scrap and refined secondary metal); refined-from-scrap production alone is a smaller ~17% of refined output (ICSG), and in Europe the overall recycled share is closer to 50%. Because copper does not degrade, the vast in-use stock built up over a century becomes an ever-larger scrap reservoir.
Recycling is the price-sensitive, elastic part of supply: when prices are high, more scrap is collected and processed, cushioning the rise; mine supply, by contrast, is highly inelastic in the short run because a new mine takes 10–20 years from discovery to first metal. This combination — slow primary supply plus responsive scrap — is why copper can spike sharply when demand surprises to the upside, then mean-revert as scrap and idle capacity return. Unlike gold, there is no monetary stock-to-flow dynamic; copper’s “stock” is the metal already working in the economy, not bullion in a vault.
Table 12. Copper supply structure, 2024
| Supply source | Approx. share of total supply | Price elasticity |
|---|---|---|
| Primary mine production | ~68% | Low (10–20-yr lead times) |
| Recycled / secondary (scrap) | ~32% | High (responds to price) |
| Memo: secondary (scrap-based) share of refined output | ~17% | — |
| Memo: by-product/co-product copper | meaningful share of mine | Low (host-metal driven) |
Source: recycling shares from the International Copper Association and ICSG , 2024; mine vs. secondary split approximate. “Total supply” includes direct-melt scrap as well as refined secondary.
2.6 Trade flows: concentrate, cathode & the road to China
Copper’s trade map is the mirror image of its demand map. Because the metal is mined in the Andes and Africa but consumed and refined overwhelmingly in Asia, two great flows dominate: concentrate moving from mines (Chile, Peru, and increasingly the DRC and Indonesia) to smelters (heavily in China, plus Japan, South Korea and India), and refined cathode moving from refineries to fabricators. Copper is bulky and low-value-per-tonne compared with gold, so it travels by bulk carrier and container — but there are no single maritime choke points of the Hormuz/Malacca kind that can sever the trade. The real vulnerability is concentration of smelting in China, which gives Beijing structural leverage over where the world’s concentrate gets turned into metal and over the TC/RC fees miners pay.
The directional flow is consistent: Andean and African concentrate and cathode move west-to-east and south-to-north into China, with Chile the largest single supplier of refined copper to the United States and the dominant concentrate exporter overall. China is the largest importer of concentrate, refined copper and scrap simultaneously. A 2025 wrinkle worth noting briefly: U.S. tariff action on copper imports pulled large volumes of refined metal toward the United States and opened an unusual COMEX-over-LME premium — a live policy situation rather than a settled structural feature.
Table 13. Major copper trade roles
| Player | Role | Direction |
|---|---|---|
| Chile | Largest mine & concentrate/cathode exporter | Net exporter |
| Peru | Major concentrate exporter | Net exporter |
| Congo (Kinshasa) | Fast-growing cathode & concentrate exporter | Net exporter |
| China | Largest smelter, refiner, importer & consumer | Net importer (concentrate, refined, scrap) |
| Japan / South Korea | Major custom smelters | Concentrate in → cathode out |
Source: ICSG , USGS and UN Comtrade , 2024.
Figure 9. Global copper trade flows
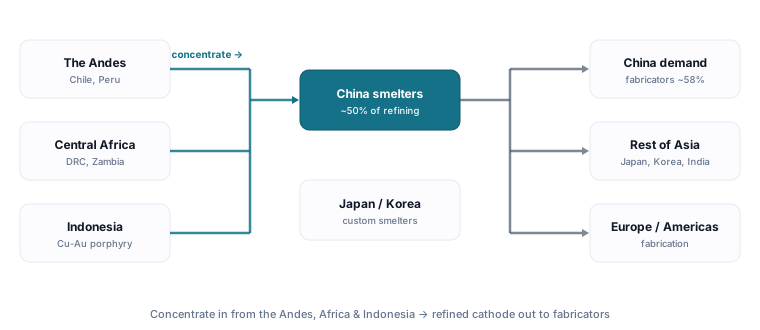
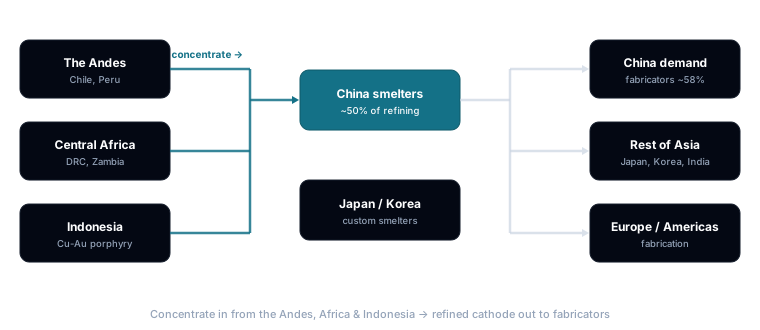
Source: ICSG, USGS and UN Comtrade, 2024; see Table 13.
2.7 Market organisations & supply coordination
Copper has no OPEC — no producer cartel sets quotas or coordinates mine supply. Production is spread across dozens of countries and many private companies, and the strategic leverage has migrated downstream to smelting, where China dominates. Instead, several different bodies shape the market.
First, the statistical and industry bodies: the International Copper Study Group (ICSG), an intergovernmental organisation whose roughly two dozen member states — including major producers and consumers such as Chile, Peru, Japan, South Korea, Poland, Portugal, Russia, India, Mexico, Finland, Germany, Belgium and the United States — together represent the bulk of world trade. The ICSG gathers and publishes the authoritative supply, demand and balance statistics, but it sets no quotas. The International Copper Association (ICA) is the industry’s market-development and recycling body. Exchange operators — the LME, CME/COMEX and SHFE — set the rules of trading and the reference prices.
Second, and uniquely for copper, there is real coordination on the smelter side. China’s leading smelters operate a China Smelters Purchase Team (CSPT) that periodically sets a floor guidance for treatment and refining charges, effectively coordinating the buy side of the concentrate market. State actors also matter directly: Codelco, Chile’s state copper company, is the single largest producer, and Chile’s Cochilco and ENAMI shape national policy. Governments intervene through royalties and taxes (Chile, Peru, the DRC), export rules (Indonesia’s concentrate-export restrictions to force domestic smelting) and, in 2025, U.S. import tariffs.
Table 14. Copper market bodies and where the leverage sits
| Body / actor | Role | Leverage |
|---|---|---|
| ICSG | Intergovernmental statistics & study group | Data, not quotas |
| ICA | Industry market development & recycling | Demand-side, advocacy |
| LME / COMEX / SHFE | Exchanges & price discovery | Set reference prices |
| CSPT (China smelters) | Coordinate concentrate purchasing | TC/RC floor guidance |
| Codelco / Cochilco (Chile) | State producer & policy | Largest single producer |
Source: ICSG , International Copper Association , LME , Cochilco , 2025.
3. The companies & the value chain
3.1 The largest copper companies
Copper mining is fragmented at the top: no single company controls more than ~6–7% of world mine output. The way to size up producers in an evergreen guide is by durable fundamentals — production, reserves and reserve life — not market capitalisation or share price, which move daily and date a report instantly. By annual mine output the leaders are Chile’s state-owned Codelco and BHP (whose majority stake in Escondida makes it the largest single private producer), followed by Freeport-McMoRan (US), Glencore (Switzerland), China’s Zijin Mining, and Southern Copper (controlled by Grupo México), which holds among the largest reserves of any listed producer. Anglo American, Antofagasta, KGHM and First Quantum round out the majors.
Table 15. Leading copper producers by output and reserves, 2024
| Company | Country | Type | Listing | Mine output (kt Cu) | Copper reserves (Mt) | Reserve life (yrs) |
|---|---|---|---|---|---|---|
| Codelco | Chile | State major | State-owned (unlisted) | 1,440 | ~70 | high |
| BHP | Australia | Diversified major | Public (ASX: BHP) | 1,430 | ~45 | ~30 |
| Freeport-McMoRan | United States | Major (Cu, Au) | Public (NYSE: FCX) | 1,270 | ~48 | ~30 |
| Zijin Mining | China | Diversified (Cu, Au) | Public (SSE: 601899) | 1,070 | ~75 | high |
| Glencore | Switzerland | Diversified | Public (LSE: GLEN) | 1,070 | ~35 | ~30 |
| Southern Copper | Mexico/Peru | Major (Cu, Mo) | Public (NYSE: SCCO) | 900 | ~45 | very high |
| Anglo American | UK | Diversified major | Public (LSE: AAL) | 770 | ~30 | high |
| KGHM | Poland | Major (Cu, Ag) | Public (WSE: KGH) | 710 | ~30 | high |
Source: company annual reports and reserve statements (10-K / AIF), full-year 2024; production is attributable (not 100%-consolidated) mine-produced copper and reserves are as reported on differing bases (Codelco and Southern Copper report exceptionally large reserves; Freeport’s reserve-life figure uses consistent attributable bases, so it does not equal the consolidated reserves column divided by attributable production — verify against the 10-K at each refresh). Listing gives each company’s primary exchange and ticker: Codelco is 100% Chilean state-owned and unlisted, while KGHM (Polish State Treasury ~32%), Zijin (state-linked largest shareholder) and Southern Copper (controlled by Grupo México) trade publicly but sit under a controlling or major state/parent shareholder. No market-capitalisation figures are shown by design.
3.2 Company archetypes along the value chain
Copper exposure is not one trade — the business models sit at very different points on the risk/return spectrum, and an investor should match the archetype to the goal (leverage, diversification, safety). Explorers look for deposits: pure option value, no cash flow, binary outcomes. Developers are permitting and building a mine: high capital risk, value unlocked at first production — and copper projects are notoriously long and capital-hungry. Pure-play producers mine and sell copper: direct, leveraged exposure to the price, with margins set by their cost-curve position. Diversified miners (BHP, Glencore, Anglo) blend copper with iron ore, coal or other metals, dampening copper leverage but adding stability. Smelters/refiners and fabricators earn processing margins (TC/RCs and conversion fees) rather than price exposure, and royalty & streaming companies finance miners for a slice of output — the lowest-risk way to own the theme.
Table 16. Copper company archetypes
| Archetype | What they do | Revenue model | Price sensitivity |
|---|---|---|---|
| Explorer | Search for deposits | None (raise & spend) | Very high (sentiment) |
| Developer | Permit & build mines | None until production | High |
| Pure-play producer | Mine & sell copper | Copper sales − cost | High (operating leverage) |
| Diversified miner | Copper + other commodities | Multi-commodity sales | Medium (blended) |
| Smelter / fabricator | Process concentrate / make semis | TC/RCs, conversion margin | Low (fee-based) |
| Royalty / streaming | Finance miners for a cut | Royalty / stream income | Medium (capped cost) |
Source: company filings; the Metal Pilot project-type taxonomy, 2025.
Figure 10. Copper company archetypes by price sensitivity
Source: company filings; conceptual, see Table 16.
3.3 Infrastructure & balance-sheet assets
What a copper company actually owns — and how those assets are measured — determines what its filings are telling you. A producer’s balance sheet is built on its mineral reserves and resources (measured in Mt of contained copper and % Cu grade, valued via the net present value of the mine plan at a discount rate), its mines (open-pit or block-cave underground operations, measured by ore throughput and strip ratio), and its processing plant (concentrators, smelters, SX-EW circuits, measured by capacity, utilisation and recovery). As with gold, the number that most often misleads is gross vs. net: reserves and production are frequently quoted on a 100% basis even where the company owns only part of a joint venture (Escondida, Antamina, Grasberg), so the attributable figure is the one that flows to shareholders. By-product credits (gold, silver, molybdenum) materially change the economics and must be read alongside the headline cost.
Table 17. Copper-company asset types and metrics
| Asset type | What it does | Key metric | Unit |
|---|---|---|---|
| Reserves & resources | The in-ground copper base | 2P reserves; grade | Mt; % Cu |
| Mines (pit / block cave) | Extract ore | Throughput; strip ratio; mine life | Mt/yr; ratio; years |
| Concentrator | Flotation to concentrate | Capacity; recovery | Mt/yr; % |
| Smelter / refinery / SX-EW | Make anode & cathode | Capacity; utilisation | kt/yr; % |
| By-product streams | Gold, silver, molybdenum | By-product credit | $/t Cu |
Source: company reserve statements (SEC S-K 1300 / NI 43-101) and annual reports, 2024; Metal Pilot project data.
4. Investing in copper
4.1 Ways to own it — exposure vehicles
Copper’s first investment question is practical: you cannot sensibly hold the metal. At roughly $9,500 a tonne, a meaningful physical position is bulky, uninsurable at home and illiquid to sell — so unlike gold, physical ownership is off the menu, and the choice is between paper copper and copper businesses. Futures (LME and COMEX) are the direct instrument — leveraged, margined and rolled, a professional’s tool. Futures-based ETPs wrap that mechanism for retail buyers, and inherit its structural flaw: a fund that holds futures must roll them, and in contango (copper’s normal state, reflecting carry) each roll sells cheap and buys dear — a recurring drag that compounds into long-run underperformance versus spot. Copper’s contango is usually mild, so the bleed is slower than crude oil’s worst episodes (the oil guide shows that trap in full), but over years it is real: a copper ETP is a tactical instrument, not a buy-and-hold. For long horizons the practical routes are the equities: pure-play miners for maximum leverage, diversified majors for a cushioned version, smelters for fee-based processing exposure, and royalty companies for the lowest-risk claim — the archetype spectrum of Section 3.2.
Table 18. Ways to own copper
| Vehicle | What you actually own | Tracks spot? | Key structural cost / risk | Best suited for |
|---|---|---|---|---|
| Futures (LME / COMEX) | Exchange contracts (25 t / 25,000 lb) | Yes, near-term | Leverage, margin calls, roll mechanics | Professionals, hedgers |
| Futures-based ETP | A rolled futures position | Poorly over time | Contango roll drag (see above) | Short-term tactical views |
| Pure-play miner equities | Copper businesses | No — amplifies | Operating leverage cuts both ways | Leverage to the price |
| Diversified miners | Multi-commodity businesses | Loosely | Other commodities dilute the signal | Core resources exposure |
| Smelter / fabricator equities | Processing margins (TC/RCs) | Weakly | Fee squeeze when concentrate is tight | Special situations |
| Royalty / streaming | Financing claims on many mines | No — smoother | Deal risk, diversified | Lower-risk equity exposure |
Source: vehicle structures per LME and CME contract specifications and issuer product documentation; structural attributes only — no fees or prices, which change.
4.2 How to value & screen copper miners
The facts above turn into a repeatable checklist. For a producer, the metrics that matter are the resource and reserve base (how many tonnes, at what grade), all-in sustaining cost (AISC) and C1 cash cost per pound (net of by-product credits — a low-cost miner in the bottom half of the curve keeps producing through a downturn; a high-cost miner is squeezed first), reserve life, and the all-in margin (realised price minus AISC). Because copper mines so often carry gold, silver and molybdenum, watch how heavily a “copper” miner leans on by-product credits to flatter its cost. For developers, it is the project’s NPV and internal rate of return at a conservative copper price, the (often very large) capital cost, and the permitting path; for explorers, it is grade, drill results and jurisdiction.
The single most useful tool is the cost curve: rank the world’s production from cheapest to most expensive AISC, draw the long-run average price across it, and you can see at a glance who earns a fat margin and who barely survives. The same data lets you compare a producer’s valuation against its reserves — the kind of screen (resource base, AISC, reserve life) you can run across every copper company on Metal Pilot.
Table 19. Copper-miner screening metrics
| Metric | What it tells you | Good vs. concerning | Where to find it |
|---|---|---|---|
| Reserves / resources (Mt) | Scale and longevity | Larger, higher-grade is better | Reserve statement |
| C1 / AISC ($/lb) | Cost competitiveness | Bottom-half of curve healthy; top-quartile stressed | Annual report / MD&A |
| Reserve life (yrs) | Runway before replacement | >15 comfortable; <8 a worry | Reserves ÷ production |
| By-product credit reliance | Cost quality | Modest reliance is more durable | Cost notes / MD&A |
| Grade (% Cu) | Ore quality | Higher = lower cost | Reserve statement |
Source: company MD&A and reserve statements, 2024; cost-curve concept per the Metal Pilot model reference.
Figure 11. Illustrative copper cost curve (AISC vs. cumulative output)
Chart source: illustrative; AISC ranges from company MD&A, 2024, price line from Table 3. Stylised, not company-level data.
4.3 Macro regimes, rates & correlations
Copper’s behaviour across the economic cycle is the heart of its investment case, and it is the opposite of gold’s . Where gold is a non-yielding safe haven, copper is a pro-cyclical industrial input whose demand rises and falls with global growth — hence “Dr. Copper”. (For how all the major commodities compare across these same regimes, see the macro regime guide .) The dominant channel is not interest rates directly but the global industrial cycle, led by China: when factories, construction and grids expand, copper demand and price climb; when they contract, copper falls hard.
Copper tends to do best in: global expansions and early-cycle recoveries (the classic restock-and-build phase); periods of strong Chinese growth or stimulus; a weakening dollar (copper is dollar-priced); and structural-demand waves such as the current electrification build-out. It tends to struggle in: recessions and growth scares, Chinese property/credit slowdowns, and a strongly rising dollar. Interest rates matter mainly through their effect on growth and the dollar — rate cuts that revive activity are usually supportive, while hikes that choke growth are a headwind. The 2021–2025 period showed both forces at once: tight monetary policy weighed on demand, but the electrification thesis and supply constraints pushed prices to records anyway.
Table 20. Copper across economic regimes
| Regime | Typical copper performance | Why | Example |
|---|---|---|---|
| Global expansion / early cycle | Strong | Industrial restock & build | 2003–2007; 2021 |
| China stimulus / strong growth | Strong | China is ~58% of demand | 2009–2011 |
| Falling dollar / reflation | Strong | Dollar-priced, growth-geared | 2020–2021 |
| Recession / growth scare | Weak | Demand destruction | 2008–2009; 2015 |
| China property/credit slowdown | Weak | Construction demand falls | 2014–2016; 2022 |
| Strong dollar, tightening into slowdown | Weak | Dollar + demand headwind | 2018; mid-2022 |
Source: long-run price series (IMF/LME ) with growth/CPI data from FRED , author analysis. Regime averages are historical, not predictive.
On past performance, copper delivered enormous gains in the 2003–2011 supercycle (roughly a five-fold rise from its 2001–2003 lows to the 2011 peak), then fell more than 50% into the 2016 trough, before electrification demand drove a second doubling into the 2024–2025 records. Over the full 2000–2025 window it has outpaced inflation, but with much deeper, more frequent drawdowns than gold — copper is a higher-beta, more volatile holding whose cycles track industrial activity. Past performance is not indicative of future results.
The equity amplifier. The miners magnify every one of those cycles, and 2008–2010 is the concluded case study: LME copper fell roughly −67% from its July 2008 peak ($8,900/t) to the December trough ($2,800/t), while Freeport-McMoRan — the largest listed pure-play — fell about −85% over the same months; in the stimulus rebound that followed, copper roughly tripled off its low and Freeport did meaningfully better still. Operating leverage plus balance-sheet leverage make copper equities a geared, noisier version of the metal in both directions — the exposure most readers actually hold, and the reason the archetype choice in Section 3.2 matters more than the entry price. (Data: LME/IMF copper series and NYSE price history, 2008–2010 — a concluded episode.)
On correlations (monthly data, 2000–2024), copper has a positive relationship with global equities and risk assets (≈ +0.4 to +0.5 with the S&P 500), a positive link to crude oil (≈ +0.5, both growth-geared), a negative relationship with the US dollar (≈ −0.4), a moderate positive correlation with gold (≈ +0.3 to +0.4, stronger in reflationary phases), and the tightest link of all to Chinese industrial activity and PMIs. The gold-copper ratio is watched as a risk gauge (rising when growth fears dominate). These relationships are sample-dependent and break down in crises, when most things briefly correlate.
Table 21. Copper correlations (monthly, 2000–2024)
| Asset | Correlation with copper | Note |
|---|---|---|
| S&P 500 / global equities | ≈ +0.5 (positive) | Both growth-geared |
| Crude oil (Brent) | ≈ +0.5 (positive) | Shared cycle |
| US dollar (DXY) | ≈ −0.4 (negative) | Dollar-priced asset |
| Gold | ≈ +0.3 (low-moderate) | Stronger in reflation |
| China industrial PMI | strong positive | China is ~58% of demand |
Source: author analysis of FRED , IMF/LME series, monthly, 2000–2024. Correlations are time-varying and can break down in crises.
Figure 12. Copper correlations, monthly 2000–2024
Figure data: Table 21.
4.4 Price drivers & cycles
Stripping out the noise, the copper price is driven by a short list of forces — and the clearest evidence comes from concluded historical episodes, not live events. On the demand side: global and Chinese industrial growth (the dominant lever), the energy transition (grids, EVs, renewables, data centres), the US dollar, and inventory/restocking cycles. On the supply side: the slow, capital-intensive response of mine output (a decade-plus from discovery to first metal), falling ore grades, disruptions (strikes, water shortages, permitting), and the faster response of scrap and smelter utilisation. The recurring pattern is that copper booms when demand outruns a slow supply pipeline, then busts when high prices finally bring on new mines just as demand cools.
The settled case studies that illustrate the drivers: the 2003–2008 China supercycle carried copper from ~$1,800 to nearly $9,000/t as Chinese construction and manufacturing exploded; the 2008 global financial crisis then crashed it by roughly two-thirds in months as demand evaporated. A sharp 2009–2011 rebound on Chinese stimulus drove a record above $10,000/t, followed by the 2011–2016 bear market as that stimulus faded and new supply arrived. The 2020 pandemic caused a brief crash and a violent V-shaped recovery as China rebounded and stimulus flowed. Each of these is resolved history; the durable lesson is that copper rallies when industrial demand outpaces a slow-moving supply base, and falls when growth disappoints or new mines finally catch up.
Table 22. Copper price drivers
| Driver | Direction of effect | Why | What to watch |
|---|---|---|---|
| Global / China growth | Faster growth → higher copper | ~58% of demand is China | PMIs, China property & grid spend |
| Energy transition | More electrification → higher copper | Grids, EVs, renewables, AI | EV sales, grid capex |
| US dollar | Weaker USD → higher copper | Copper is dollar-priced | DXY index |
| Mine supply & grades | More/cheaper supply → drag | Slow, inelastic, grades falling | USGS / ICSG supply, TC/RCs |
| Inventories & scrap | Low stocks → higher copper | Buffer against tightness | LME/SHFE/COMEX stocks |
| Disruptions | Strikes/outages → spikes | Concentrated supply | Chile/Peru/DRC news |
Source: agency outlooks (USGS , ICSG ) and long-run price history. Case studies are concluded historical episodes.
4.5 Risks, controversies & ESG
The bull case has real counterweights. The dominant financial risk is the cycle itself: copper is high-beta to global growth, so a genuine recession or a deeper Chinese slowdown can cut the price by half, as 2008 and 2015 showed. A strong dollar is a parallel headwind, and demand substitution is a slow but real threat — aluminium replaces copper in some power cables and increasingly in EV components and motors when the copper price runs too far, and thrifting trims the copper content of equipment over time.
On the non-financial side, copper mining carries serious ESG exposure. Open-pit porphyry mining moves enormous volumes of rock and consumes large amounts of water, often in water-stressed regions like Chile’s Atacama, driving a costly shift to desalination. Tailings-dam safety, energy intensity, and community and Indigenous opposition are recurring flashpoints — the 2023 court-ordered shutdown of First Quantum’s Cobre Panamá mine, one of the world’s largest, is a concluded example of how social and legal risk can remove ~1.5% of world supply overnight. Resource nationalism — higher royalties and taxes in Chile, Peru and the DRC, and export controls in Indonesia — is a structural feature. Set against that, copper’s defenders note it is the enabling metal of decarbonisation and is infinitely recyclable, so secondary supply can grow with a fraction of the footprint. These are contested questions, and reasonable analysts weigh them differently.
Figure 13. Copper risk map — likelihood vs. impact
Source: author’s qualitative assessment; see Section 4.5.
5. Future outlook & forecasts
The forward view for copper is, more than for almost any other metal, a bet on electrification. Forecasts are scenarios, not measured facts — they hinge on assumptions about growth, policy and the pace of the energy transition — but the major agencies and consultancies agree on the shape: demand grows materially through 2050, while mined supply struggles to keep pace, so a structural gap opens within a decade.
5.1 Demand
The IEA, in its Global Critical Minerals Outlook 2025, puts refined copper demand at roughly 27 Mt in 2024, rising to about 30 Mt by 2030, ~33 Mt by 2035 and ~37 Mt by 2050 under its base-case Stated Policies Scenario (STEPS) — the largest absolute demand increase of any energy-transition metal. S&P Global is more aggressive, seeing demand climb from about 28 Mt in 2025 to ~42 Mt by 2040 (roughly +50%), and Wood Mackenzie projects demand up about 24% to roughly 43 Mt by 2035. The common thread is energy-transition uses — EVs, battery storage, renewables, grid build-out and now AI data centres — driving most of the growth on top of steady construction and industrial demand.
5.2 Supply and the gap
The harder half of the story is supply. The IEA estimates that output from existing and announced mine projects would cover only about 70% of projected 2035 demand under STEPS — an implied ~30% gap (~10 Mt) — widening to ~35% under the Announced Pledges Scenario and over 40% under Net Zero, as ore grades fall (down ~40% since the early 1990s), capital costs rise, permitting lengthens and large discoveries thin out. Wood Mackenzie similarly sees a need for more than 8 Mt/yr of new mine capacity (plus ~3.5 Mt/yr more scrap) and over $210 bn of investment by 2035, while S&P Global projects copper falling about 10 Mt short of demand by 2040. Nearer term, the balance is already tipping from a slim 2024–25 surplus into deficit around 2026 (Section 2.4); the structural question is the decade after. The shock absorbers are recycling (already about a third of demand; Section 2.5) and price-induced substitution and thrifting — and, ultimately, the new mines that today’s record prices are meant to call forth.
Table 23. Copper demand, mined supply and the emerging gap, 2024–2050 (Mt)
| Forecast (source · scenario) | 2024 | 2030 | 2035 | 2040 | 2050 |
|---|---|---|---|---|---|
| Refined demand — IEA, STEPS | 27 | ~30 | 33 | — | 37 |
| Refined demand — S&P Global | ~28 | — | — | ~42 | — |
| Total demand — Wood Mackenzie | — | — | ~43 | — | — |
| Mined supply, existing & announced projects — IEA, STEPS | ~23 | ~25 | ~23 | — | — |
| Implied supply gap — IEA, STEPS | ~0 | small | ~30% (~10 Mt) | — | — |
Source: IEA Global Critical Minerals Outlook 2025 , 2025; S&P Global — Copper in the Age of AI , 2025; Wood Mackenzie — soaring copper demand , 2025. Figures are scenario projections, not measured data; demand bases differ slightly (IEA and S&P refined copper vs. Wood Mackenzie total).
Figure 14. Copper demand vs. mined supply to 2035 (Mt, IEA STEPS)
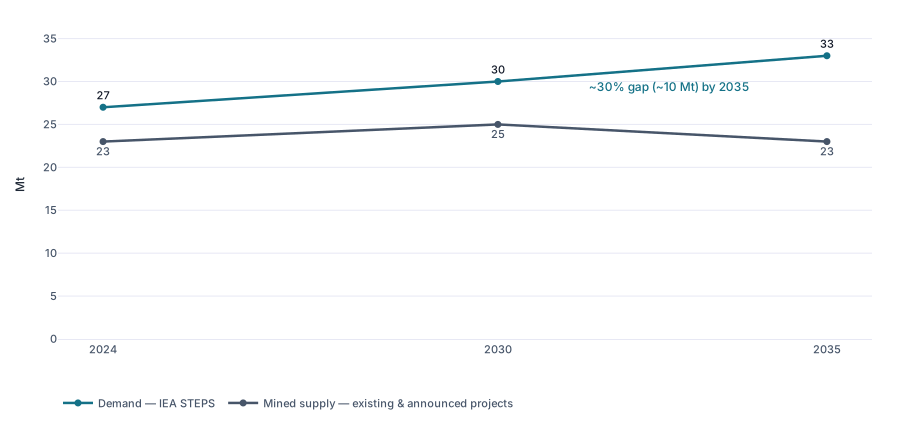
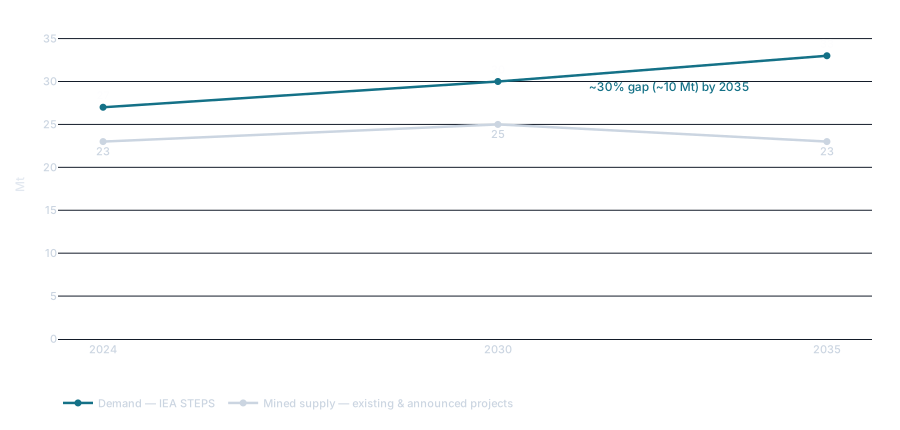
Source: IEA Global Critical Minerals Outlook 2025 , 2025. Demand is the STEPS scenario; mined supply is existing and announced projects. Scenario projections, not measured data.
5.3 Catalysts to watch
The forward watch-list is concrete. In the near term, the path of global and Chinese growth (PMIs, property and grid spending), exchange inventories (LME/SHFE/COMEX stocks), the annual TC/RC negotiations (a tell on concentrate tightness) and mine disruptions or restarts (a Cobre Panamá restart would add ~350 kt) dominate. Over 3–10 years, the structural theme is the gap above: electrification demand against a constrained mine-supply pipeline of falling grades, long permitting and few large discoveries, partly offset by rising recycling. What would confirm the bull thesis: persistent electrification demand and a stubbornly thin project pipeline. What would break it: a durable global recession, a hard Chinese slowdown, or faster-than-expected substitution and supply growth.
Table 24. Copper catalyst calendar
| Catalyst / theme | Timing | Why it matters | Watch |
|---|---|---|---|
| China growth & stimulus | Ongoing | ~58% of demand | PMIs, property, grid capex |
| TC/RC settlements | Annual (Q4) | Concentrate-market tightness | Smelter benchmark talks |
| Exchange inventories | Continuous | Short-term price driver | LME / SHFE / COMEX stocks |
| ICSG balance forecasts | Twice yearly | Supply–demand outlook | icsg.org |
| USGS Mineral Commodity Summaries | Annual (Jan/Feb) | Supply & reserves update | usgs.gov |
| Major mine start-ups / disruptions | Multi-year | Supply pipeline | Company guidance |
Source: ICSG , USGS and exchange calendars.
6. Summary
Copper is the metal that carries the modern economy’s electricity, and the indispensable input of the energy transition. Physically it is the cheapest high-conductivity metal — consumed and locked into buildings, cables and machines rather than hoarded — so its price is set on the LME, COMEX and Shanghai exchanges and is best read as a multi-year average, which rose from ~$1,800/t in 2000 to ~$9,142 in 2024 and ~$9,947 in 2025. It is mined in a few belts — Chile, the DRC and Peru lead, and the Andes alone are ~35% of supply — while China refines roughly half of the world’s copper and consumes ~58% of it, the defining asymmetry of the market. Demand rests on equipment, construction, infrastructure, transport and industry, with the structural growth coming from electrification — grids, EVs, renewables and data centres. The market clears at roughly 23 Mt of mine supply, ~27 Mt of refined production and a recycling layer near a third of supply, with the concentration of smelting in China the real choke point rather than any shipping lane, and the balance tilting from slim surplus toward deficit later this decade. The companies that mine it — Codelco, BHP, Freeport, Glencore, Zijin and peers — are best compared on production, reserves and cost, never on a fast-moving market cap, and they span everything from binary explorers to fee-based smelters and royalty firms. Copper’s regime is clear: it is “Dr. Copper”, rewarding global expansion, Chinese strength and a weak dollar, and punishing recessions and slowdowns — with the electrification build-out the structural force now layered on top. The single most important variable to watch is the pace of global and Chinese industrial growth, with the mine-supply pipeline close behind.
To go from this big-picture view to the actual companies — screening every copper producer by reserves, AISC and reserve life — explore Metal Pilot.
7. Vocabulary
Every specialised term used in this report, defined once at first use in the body, collected here for reference.
Table 25. Copper vocabulary
| Term | Plain-language definition | Why it matters to an investor |
|---|---|---|
| Ore grade (% Cu) | Copper as a % of mined rock | Decides whether a deposit is economic; grades are falling |
| Porphyry deposit | Large, low-grade copper body in intrusive rock | The source of most of the world’s copper |
| Oxide vs. sulfide | The two ore types, processed differently | Sets the processing route (SX-EW vs. smelting) |
| Concentrate | ~25–30% Cu powder from flotation | The form that ships from mine to smelter |
| Flotation | Froth process that concentrates sulfide ore | Recovery here drives real output |
| Smelting | Melting concentrate to ~99% blister/anode | The China-concentrated mid-chain step |
| Cathode (Grade A) | 99.99% refined copper sheet | The product every price quotes |
| SX-EW | Leach + electrowin oxide ore to cathode | Skips the smelter; lower cost for oxide ores |
| TC/RC | Treatment & refining charge paid to smelters | Low TC/RCs signal a tight concentrate market |
| C1 cash cost | Direct cash cost per pound/tonne | Narrow cost measure, net of by-products |
| AISC | All-in sustaining cost | Headline cost; who survives a downturn |
| By-product credit | Revenue from gold/silver/moly netted off cost | Can push a copper mine’s cost sharply lower |
| Reserves vs. resources | Economically mineable vs. broader geological estimate | Reserves are bankable; resources are upside |
| Proven & probable (2P) | The two reserve confidence categories | The reserve base used to value a producer |
| Cut-off grade | Lowest grade worth mining at a given price | Rises and falls with the copper price |
| Recovery rate | % of contained copper actually extracted | Drives real output and unit cost |
| Reserve life | Reserves ÷ annual production (years) | Runway before a company must replace tonnes |
| Strip ratio | Waste rock moved per tonne of ore | A key open-pit cost driver |
| Scrap (No.1 / No.2) | Recycled copper, by purity grade | The price-sensitive part of supply |
| Secondary refined | Refined copper made from scrap | ~30% of refined output; lower footprint |
| Cathode premium | Physical surcharge over the exchange price | Signals regional tightness (e.g. Yangshan) |
| Contango / backwardation | Futures above / below spot | Carry vs. nearby scarcity (market stress) |
| Dr. Copper | Copper as a barometer of global growth | Why the price tracks the economic cycle |
Source: definitions follow SEC S-K 1300 / CIM reserve standards and the ICSG and Copper Development Association glossaries, 2025.
8. Sources, methodology & disclaimer
8.1 Sources, methodology & data vintage
Agencies & official data: USGS Mineral Commodity Summaries 2026: Copper ; USGS Copper Statistics and Information ; IMF Primary Commodity Prices / Global price of Copper (LME) ; FRED (Federal Reserve) for dollar, growth and CPI data.
Industry & exchanges: International Copper Study Group (ICSG) for production, usage, end-use and balance; International Copper Association for recycling; LME , CME Group / COMEX and SHFE for prices; UN Comtrade for trade flows.
Company filings: annual reports, 10-K and AIF reserve statements (SEC S-K 1300 / NI 43-101) for Codelco, BHP, Freeport-McMoRan, Glencore, Zijin Mining, Southern Copper, Anglo American and KGHM, full-year 2024.
Methodology: prices are calendar-year averages (IMF/LME annual averages, 2000–2025), never spot snapshots. Mine production, refinery production and reserves follow the USGS; usage, end-use and balance follow the ICSG. Regional demand splits and company reserves are approximate and reported on differing bases — each figure is attributed to its source. Correlations use monthly data over 2000–2024 and are historical. Reserves, resources and forecasts are estimates, not measured facts.
Data as of: June 2026. Intended update cadence: annually, after the USGS Mineral Commodity Summaries (January/February) and the ICSG World Copper Factbook and forecasts.
8.2 Disclaimer & disclosure
This report is for informational purposes only and is not investment advice, a recommendation, or an offer to buy or sell any security or commodity. Copper prices are volatile, and the figures here are estimates as of the stated date that will change; reserves, resources, correlations and regime averages are estimates and historical observations that may not persist. Do your own research and consult a licensed financial adviser before acting. This report was prepared with the assistance of AI; its figures were sourced from the references above and reviewed, but readers should verify any number before relying on it. The author holds no position disclosed as a conflict in respect of the companies named.