

Nickel — A Complete Market Guide (2026)
Data as of 6 July 2026. Prices are quoted as multi-year and full-year averages, not a single day’s snapshot, so this report stays useful over time. Reserves, production splits, balances, and historical series are estimates from agency data, rounded for clarity. This report is for information only and was prepared with AI assistance — see the disclaimer at the end.
Nickel is the metal that makes stainless steel stainless — and, more recently, the energy-dense heart of the nickel-rich batteries that power long-range electric vehicles. No major metal market has been remade as fast or as completely as the nickel market: in a single decade, Indonesia went from ore exporter to producer of roughly two-thirds of the world’s mined nickel, a Chinese-built processing complex rewrote the cost curve, and the London nickel market broke so badly in 2022 that the exchange cancelled billions of dollars of trades. This report is the free, big-picture primer on how the nickel market actually works — where it comes from, who processes and buys it, how its price is set, and which economic regimes favour it. For the company-level data behind the charts — every producer screened by production, resources and cost — go to Metal Pilot.
TL;DR & Key Takeaways
- What it is: a hard, corrosion-resistant industrial metal whose defining job is alloying — roughly two-thirds of primary nickel goes into stainless steel, with batteries the fast-growing second pillar (~6% of use in 2018, ~17% by 2024). Like copper, nickel is consumed in use, so the market is driven by industrial flow, not a hoard.
- Market structure: the supply side has been transformed by Indonesia, which mined roughly two-thirds of the world’s nickel in 2025 and, with China, controls most of the processing. There is no producer cartel, but Indonesian policy — export bans, mining quotas, royalties — is the closest thing the market has to a swing producer.
- Demand story: China consumes about 64% of primary nickel, overwhelmingly for stainless steel; Indonesia’s own stainless and battery plants have made it the number-two consumer. The structural growth story is nickel-rich EV batteries — real, but slower than the 2021-era hype, as cheaper nickel-free LFP chemistry takes share.
- Price regime: nickel is a pro-cyclical, dollar-priced industrial metal — historically the most volatile of the major base metals, from the ~$52,200/t spike of 2007 to the 2022 short squeeze that briefly doubled the price in hours. Since 2023 a wave of Indonesian supply has pushed the market into persistent surplus, with prices averaging ~$15,200/t in 2025.
- Biggest swing factor: Indonesian supply policy — the pace at which one country’s mines, quotas and royalties add or withhold metal — against the pace of stainless and battery demand growth.
Numbers to remember (nickel at a glance)
Figure 1. Nickel at a glance
Figure data: USGS Mineral Commodity Summaries 2026 and INSG ; see Sections 1.3–2.7.
Why it matters now: nickel sits at the collision point of two of the decade’s biggest forces — the electrification of transport, which needs high-purity nickel, and the most aggressive resource-nationalist industrial policy in the commodity world, which has concentrated supply in one archipelago. The result is a cheap, oversupplied metal with a structurally growing demand base — exactly the kind of setup cycle-minded investors study. The big-picture case is below.
How to read this guide: new to nickel? Read straight through from Section 1. Here for the investment case? Jump to Section 4 — how to own it, how to screen the miners, and which regimes favour the metal. Every technical term is defined in the Vocabulary (Section 7).
1. Nickel & the market basics
1.1 What nickel is — physical basics & quality
Nickel (chemical symbol Ni) is a silvery-white metal prized for a combination no other cheap element offers: it resists corrosion, holds strength at extreme temperatures, and alloys readily with iron. Added to steel with chromium, it produces austenitic stainless steel — the rust-proof, formable 300-series grades used in everything from cutlery and kitchens to chemical plants and LNG tanks — which is why stainless has been nickel’s home market for a century. The same properties put nickel in superalloys for jet-engine turbines, in plating, and in specialty steels. Its newest role reverses the logic: in NMC and NCA lithium-ion cathodes, nickel is valued not for protecting other metals but for storing energy — more nickel in the cathode means more range per kilogram of battery. Unlike gold , nickel has no monetary pillar: it is a pure industrial input, consumed and locked into buildings, machines and vehicles, so demand tracks the real economy — much like its sibling base metal copper .
Nickel’s quality story starts in the ground, with two fundamentally different ore families — each defined here once and used throughout this report:
- Sulfide ores — dense, higher-grade ore bodies (roughly 1–3% Ni) formed by magmatic processes, found in Russia’s Norilsk region, Canada’s Sudbury basin and Western Australia. Sulfides are the conventional route: they concentrate easily by flotation and smelt into high-purity products, historically the source of most class 1 nickel. The catch: the great sulfide districts are old, deep and rarely discovered anymore.
- Laterite ores — shallow, lower-grade weathered blankets (roughly 1–1.8% Ni) formed in tropical climates, dominant in Indonesia, the Philippines and New Caledonia. Laterites split into an upper limonite layer (lower nickel, cobalt-bearing — processed chemically by HPAL, high-pressure acid leaching) and a deeper saprolite layer (higher nickel — smelted in RKEF rotary-kiln electric-furnace lines into nickel pig iron). Laterites are cheap to dig but energy-hungry to process; they are why supply moved to the tropics.
The product side has its own two-tier vocabulary. Class 1 nickel is refined metal of ≥99.8% purity — cathode, briquettes, powder — deliverable against the LME contract and usable in batteries (after conversion to nickel sulfate, the battery salt) or any other application. Class 2 nickel is lower-purity, iron-bearing product — nickel pig iron (NPI, ~10–14% Ni**)** and ferronickel (~20–40% Ni) — made for one customer only: the stainless mill. Between them sit the intermediates: nickel matte (~70% Ni, from smelting) and MHP (mixed hydroxide precipitate, ~35–40% Ni, from HPAL), which feed refineries and battery-chemical plants. A decade ago the classes were separate worlds; since 2021 Chinese-Indonesian operators have learned to convert NPI to matte and MHP to sulfate and cathode, so metal now flows to whichever product pays best — a structural change that keeps the whole complex tethered to the lowest-cost producer.
The value chain — from ground to alloy. Sulfide ore travels the classic path: mine → concentrator (flotation) → smelter (matte) → refinery (class 1 metal) → stainless, alloys, plating or battery chemicals. Laterite ore takes one of two shorter paths: saprolite → RKEF furnace → NPI/ferronickel → directly into the stainless mill, or limonite → HPAL autoclave → MHP → refinery → nickel sulfate → battery cathode. The concentrated choke point is the middle: roughly three-quarters of the world’s primary nickel now emerges from Indonesian and Chinese furnaces and autoclaves.
Figure 2. The nickel value chain — two ores, three routes
Source: industry value-chain primers; conceptual diagram.
1.2 Units & measurement conventions
This report uses the base-metals convention throughout, stated here so every later number is unambiguous. Nickel quantities are metric tonnes (t), thousand tonnes (kt) and million tonnes (Mt) of contained nickel — the pure-metal content inside ore, NPI, matte, MHP or refined metal — mirroring the convention of the U.S. Geological Survey (USGS) and the International Nickel Study Group (INSG). The price is quoted in US dollars per tonne (USD/t) of refined metal on the London Metal Exchange (LME); US industry data sometimes uses dollars per pound, converted at 1 tonne = 2,204.62 lb (so $15,000/t ≈ $6.80/lb). Ore and product grades are % Ni.
Two distinctions matter constantly in nickel and are flagged throughout:
- Mine vs. primary production. Mine production counts nickel in ore dug out of the ground (~3.9 Mt in 2025); primary production counts first-use nickel products made from that ore — NPI, ferronickel, cathode, sulfate (~3.8 Mt in 2025). Ore that is stockpiled, lost in processing or double-counted across borders explains the gap. Usage figures are primary nickel.
- Flow vs. stock. Production and usage are flows per year. Reserves (~140 Mt, the economically mineable subset of resources), exchange inventories (the visible metal in LME and SHFE warehouses) and consumer stocks are levels at a point in time.
Table 1. Nickel units and conversions
| Unit | Meaning | Typical magnitude in nickel | Conversion |
|---|---|---|---|
| t | Metric tonne, contained nickel | An EV battery holds ~20–40 kg | 2,204.62 lb |
| kt | Thousand tonnes | Single-operation annual output | 1,000 t |
| Mt | Million tonnes | National & global flows; reserves | 1,000 kt |
| USD/t | Dollars per tonne, refined metal | LME benchmark quote | ÷ 2,204.62 × 100 = ¢/lb |
| % Ni | Nickel grade | Laterite ore ~1–1.8%; NPI ~10–14%; matte ~70%; class 1 ≥99.8% | — |
Source: USGS Nickel Statistics and Information , 2026; LME nickel contract specifications , 2025.
Numbers intuition: a large nickel operation produces 30–70 kt/yr of contained nickel; the giant Indonesian complexes are an order of magnitude bigger — the Weda Bay mine alone accounted for roughly a seventh of world mine supply in 2023. Total primary supply (~3.8 Mt) is worth roughly $57 billion a year at recent average prices — about a quarter the size of the copper market. One LME contract is 6 tonnes; a single stainless mill can consume more nickel in a year than a mid-sized mine produces.
1.3 Pricing & benchmarks
The global reference price is the LME nickel contract (London), quoted in USD/t for class 1 metal — cathode and briquettes of ≥99.8% purity from LME-approved brands. The Shanghai Futures Exchange (SHFE) trades a parallel contract that signals Chinese physical demand. But nickel’s two-class structure means the exchange price tells only part of the story: most of the world’s nickel — NPI, ferronickel, MHP, sulfate — never touches an LME warehouse and trades at negotiated discounts or payables (a percentage of the LME price paid for the contained metal). Price-reporting agencies assess these off-exchange prices — NPI in China, MHP payables, sulfate — and the spreads between them and the LME are the market’s real-time map of which products are scarce. When Indonesian supply floods the class 2 market, NPI and MHP discounts widen even if the LME price holds; when battery demand runs hot, sulfate premiums narrow the gap.
The LME contract itself carries a scar. On 8 March 2022, against the backdrop of Russia’s invasion of Ukraine and a massive short position held by China’s Tsingshan Group, the LME price doubled in hours to over $100,000/t; the exchange suspended trading for over a week and cancelled roughly $12 billion of trades, arguing that nearly $20 billion of margin calls would otherwise have toppled several clearing members. Lawsuits from Elliott Management and Jane Street followed (dismissed in 2023), and the LME introduced daily price limits and OTC position reporting. Liquidity took years to recover — average daily volumes only surpassed pre-squeeze levels in 2025 — and the episode remains the defining case study in how a benchmark can decouple from its physical market (the full story is in Section 4.4). Nickel normally trades in mild contango (futures above spot, reflecting storage and financing carry), flipping to backwardation when nearby metal is scarce.
Table 2. Key nickel benchmarks & price markers
| Benchmark | What it prices | Pricing point | Role |
|---|---|---|---|
| LME nickel (cash/3-month) | Class 1 metal, ≥99.8% Ni | London (global warehouses) | Global reference; physical settlement |
| SHFE nickel | Class 1 metal in China | Shanghai | Chinese demand signal |
| NPI price (assessed) | Nickel pig iron, ~10–14% Ni | China/Indonesia, ex-works | The stainless feed price |
| MHP / matte payables | Intermediates, % of LME | Indonesia → China | The battery feed price |
| Nickel sulfate (assessed) | Battery-grade salt, 22% Ni | China | Cathode-chain price |
Source: LME , 2025; SHFE , 2025; price-reporting agency assessments (Fastmarkets/SMM conventions), 2025.
The long-run price story is the most violent in base metals. Nickel spent the early 2000s below $10,000/t, then rode the China stainless boom into a mania that peaked near $52,200/t in May 2007 — followed by an 80%+ collapse into the financial crisis. The 2010s brought a long bear market punctuated by Indonesia’s first ore-export ban (a brief 2014 spike) and a 2016 annual-average trough near $9,600/t. Electrification hopes and post-pandemic stimulus drove the price back above $18,000 average in 2021, the 2022 squeeze distorted that year’s average to ~$25,900, and then the Indonesian supply wave broke the market: the LME price fell 45% in 2023 — its worst year since 2008 — and averaged just ~$15,200/t in 2025, back to levels that make half the non-Indonesian industry unprofitable. The full 2000–2025 series below carries the whole arc.
Table 3. Average annual nickel price, 2000–2025 (USD/t, LME/IMF annual averages)
| Year | 2000 | 2001 | 2002 | 2003 | 2004 | 2005 | 2006 | 2007 | 2008 | 2009 | 2010 | 2011 | 2012 |
|---|---|---|---|---|---|---|---|---|---|---|---|---|---|
| Price | 8,631 | 5,970 | 6,783 | 9,630 | 13,821 | 14,778 | 24,126 | 37,136 | 21,141 | 14,667 | 21,810 | 22,909 | 17,542 |
| Year | 2013 | 2014 | 2015 | 2016 | 2017 | 2018 | 2019 | 2020 | 2021 | 2022 | 2023 | 2024 | 2025 |
|---|---|---|---|---|---|---|---|---|---|---|---|---|---|
| Price | 15,030 | 16,893 | 11,863 | 9,595 | 10,410 | 13,114 | 13,914 | 13,790 | 18,467 | 25,867 | 21,529 | 16,816 | 15,161 |
Source: IMF Primary Commodity Prices / Global price of Nickel (LME) , 2000–2025. Figures are calendar-year averages, not spot, rounded. The 2022 average is distorted upward by the March 2022 short squeeze.
Figure 3. LME nickel price, annual averages 2000–2025 (USD/t)
Figure data: Table 3.
2. Supply, demand & the market balance
2.1 Where nickel is mined — deposits & geology
Nickel supply used to be a tale of a few great sulfide districts — the Norilsk-Talnakh intrusions in Siberia (formed by ancient flood-basalt volcanism), the Sudbury basin in Ontario (the remnant of a two-billion-year-old meteorite impact), and the komatiite belts of Western Australia. Those districts still matter: they hold the highest grades, the valuable by-products (copper, platinum-group metals, cobalt) and most of the world’s class 1 refining. But the modern story is laterite: the tropical weathering blankets of the ring of fire. Indonesia’s Sulawesi and Halmahera islands, the southern Philippines and New Caledonia host vast, shallow laterite deposits that were long considered second-rate — until Chinese RKEF technology (and later HPAL) made them the cheapest nickel units on Earth.
The consequence is a concentration no other base metal approaches: Indonesia mined an estimated 2.6 Mt of nickel in 2025 — about two-thirds of the world total of 3.9 Mt — with the Philippines a distant second and the old sulfide producers (Russia, Canada) now single-digit contributors. Australia, home of the twentieth century’s great sulfide industry, saw output collapse 54% in 2025 alone as low prices pushed mine after mine into care and maintenance.
Table 4. Leading nickel-mining countries, 2025 (estimated)
| Rank | Country | Mine output (kt Ni) | Share of world | Trend |
|---|---|---|---|---|
| 1 | Indonesia | 2,600 | 67% | Rising fast (+13% in 2025) |
| 2 | Philippines | 270 | 7% | Declining (−24%) |
| 3 | Russia | 200 | 5% | Flat |
| 4 | Canada | 140 | 4% | Recovering |
| 5 | New Caledonia | 140 | 4% | Recovering from 2024 crisis |
| 6 | China | 120 | 3% | Flat |
| 7 | Brazil | 70 | 2% | Flat |
| 8 | Australia | 45 | 1% | Collapsing (−54%) |
| — | United States | 10 | <1% | Single mine (Eagle) |
| — | Rest of world | 290 | 7% | — |
| — | World total | 3,900 | 100% | Up ~5% |
Source: USGS Mineral Commodity Summaries 2026: Nickel , February 2026. Figures rounded; shares approximate.
Figure 4. Leading nickel-mining countries, 2025 (kt Ni)
Figure data: Table 4.
At the asset level the concentration is starker still. The Weda Bay mine on Halmahera — majority-owned by China’s Tsingshan with France’s Eramet as minority partner — opened in 2019 and by 2023 was producing roughly a seventh of the world’s mined nickel, making it the largest nickel mine in history by an order of magnitude. Most other Indonesian supply flows through two Tsingshan-anchored industrial parks, Morowali (IMIP) and Weda Bay (IWIP), where dozens of RKEF lines and HPAL plants cluster around captive power stations and ports. Outside Indonesia, the named giants are the legacy sulfide complexes and a handful of large laterite plants.
Table 5. Major nickel mines & operations (approximate recent annual output)
| Operation | Country | Operator / owners | Output (kt Ni, ≈) | Note |
|---|---|---|---|---|
| Weda Bay | Indonesia | Tsingshan (51.3%) / Eramet / Antam | ~500 (in ore, 2023) | World’s largest nickel mine; saprolite + limonite |
| Norilsk division | Russia | Nornickel | ~170 | Sulfide; Cu-PGM by-products; class 1 |
| Obi Island (Halmahera Persada Lygend) | Indonesia | Harita Nickel / Lygend | ~65 (MHP) + FeNi | HPAL flagship; IDX-listed |
| Sorowako | Indonesia | PT Vale Indonesia | ~70 | Laterite → matte since 1978 |
| Huayue HPAL (Morowali) | Indonesia | Huayou / Tsingshan / CMOC | ~65 | Low-capex HPAL benchmark |
| Sudbury | Canada | Vale Base Metals | ~60 | Meteorite-impact sulfide district |
| Cerro Matoso | Colombia | South32 | ~40 | Ferronickel laterite |
| Ambatovy | Madagascar | Sumitomo Corp. / KOMIR | ~35 | Western HPAL; cost-overrun case study |
| Ramu | Papua New Guinea | MCC | ~35 | HPAL; MHP to China |
| Murrin Murrin | Australia | Glencore | ~35 | Surviving Australian laterite/HPAL |
Source: company annual reports and production statements, 2023–2024; Weda Bay share of global output per Eramet and mine reporting. Output on a 100% contained-nickel basis; figures approximate and rounded — Weda Bay is nickel in mined ore, others are nickel in product. Screen producing assets and owners on Metal Pilot.
2.2 Demand & consumption
Nickel demand is a stainless-steel story with a battery kicker. World primary nickel usage reached roughly 3.35 Mt in 2024 and an estimated 3.6 Mt in 2025 — up from ~1.12 Mt in 2000 and ~2.39 Mt in 2020, a growth rate near 4% a year sustained over a quarter century. Growth has barely paused: the INSG records only one down year since 2009 (a marginal dip in 2020).
By first use, stainless steel takes just under 70% of primary nickel — the 300-series austenitic grades are roughly 8% nickel by weight, and global stainless output keeps compounding on construction, consumer goods and industrial equipment. Batteries are the structural growth pillar: from ~6% of first use in 2018 to ~17% in 2024 as nickel-rich NMC and NCA chemistries scaled with the EV boom. The remainder splits among superalloys and other non-ferrous alloys (aerospace, energy), electroplating, alloy steels and foundry castings. Two caveats keep the battery story honest: nickel use in EV batteries actually dipped slightly in 2025 — subsidy withdrawals, a consumer shift toward plug-in hybrids, and above all the market-share gains of LFP (lithium iron phosphate), the cheaper, nickel-free battery chemistry — and the INSG expects renewed growth thereafter rather than uninterrupted hypergrowth.
Table 6. Global primary nickel demand by first use, 2024 (share of consumption)
| First use | Share | Note |
|---|---|---|
| Stainless steel | ~68% | 300-series austenitic grades ~8% Ni |
| Batteries | ~17% | NMC/NCA cathode precursors; EVs & storage |
| Non-ferrous alloys & superalloys | ~7% | Jet engines, energy, marine |
| Electroplating | ~4% | Corrosion & decorative coating |
| Alloy steels, castings & other | ~4% | Specialty steels, foundries, catalysts |
Source: INSG first-use data and INSG World Nickel Factbook 2024 ; battery share trajectory per INSG (~6% in 2018 to ~17% in 2024). Shares approximate, rounded.
Figure 5. Global primary nickel demand by first use, 2024
Figure data: Table 6.
Geographically, nickel demand is the most Asia-centric of any major metal: Asia consumed about 87% of primary nickel in 2024–25 (63% as recently as 2010). China alone used ~64% of the world’s primary nickel in 2024 — its share was just 5.5% in 2000 — driven by the world’s dominant stainless industry and battery-precursor complex. Indonesia became the number-two consumer in 2020, overtaking Japan, as Tsingshan-built stainless mills (and from 2025, battery plants) started melting the country’s own NPI on site; its usage passed ~400 kt in 2024. Japan, the United States and South Korea round out the top five, each stable in the 100–150 kt range; Europe’s usage has been eroding for years as its stainless industry consolidates.
Table 7. Primary nickel usage, world and leading consumers (kt)
| Consumer | 2000 | 2010 | 2020 | 2024 | Trend |
|---|---|---|---|---|---|
| China | ~60 | ~570 | ~1,360 | ~2,125 | Rising; ~64% of world |
| Indonesia | — | — | ~210 | ~400 | Rising fast; #2 since 2020 |
| Japan | ~190 | ~180 | ~150 | ~150 | Stable/declining |
| United States | ~150 | ~120 | ~110 | ~115 | Stable |
| South Korea | ~110 | ~110 | ~100 | ~100 | Stable |
| World total | 1,123 | 1,465 | 2,385 | 3,347 | ~+4%/yr since 2000 |
Source: INSG usage series and country narrative (China share 5.5% in 2000, 39% in 2010, 63.5% in 2024; Indonesia ~210 kt in 2020, ~400 kt in 2024); U.S. figure from USGS . Country figures approximate, rounded; world totals are INSG data.
Figure 6. Primary nickel usage by consumer, 2000–2024 (kt)
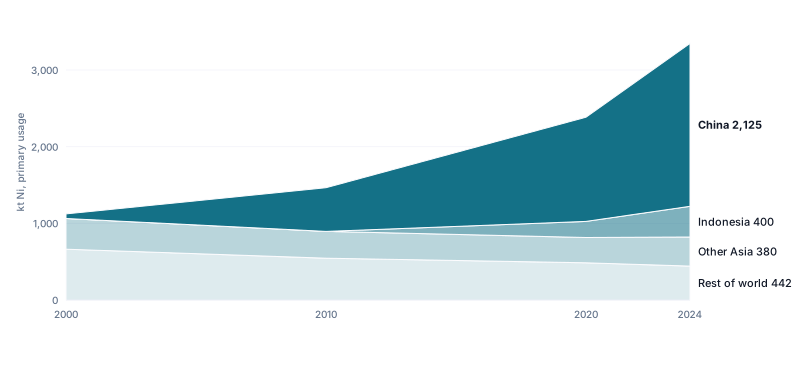
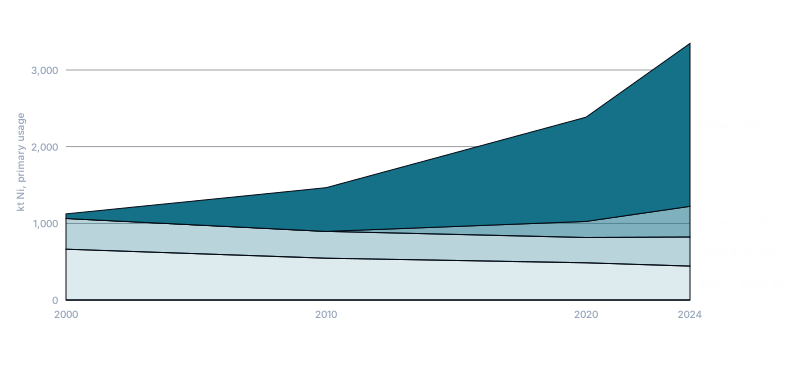
Figure data: Table 7; band labels carry 2024 values. “Other Asia” (~380 kt, mainly Japan, South Korea and India) and “Rest of world” (~442 kt) are the residual of the Table 7 world total after China and Indonesia, derived from INSG regional usage data.
2.3 Supply & the processing layer
Primary nickel supply has two layers — mining (Section 2.1) and processing into first-use products — and the second layer is just as concentrated as the first. World primary nickel production reached 3.53 Mt in 2024 and an estimated 3.81 Mt in 2025, up nearly 50% in just four years. Indonesia has been the largest primary producer since 2021 and made an estimated 1.9 Mt in 2025 (rising toward 51% of world output in 2026); China is second at ~27%, mostly converting imported ore and intermediates. Combined Chinese and Indonesian NPI alone was ~2.05 Mt in 2025 — more than half of all primary nickel. Everywhere else, the 2023–25 price collapse forced curtailments: every region outside Asia produced less primary nickel in 2024 than in 2023, with Oceania down ~39% in 2025 as Australian refineries idled.
Table 8. World nickel production, selected years (kt)
| Year | 2015 | 2020 | 2021 | 2022 | 2023 | 2024 | 2025e |
|---|---|---|---|---|---|---|---|
| Primary production | ~1,980 | ~2,500 | 2,610 | 3,060 | 3,363 | 3,526 | 3,810 |
Source: INSG production series and INSG press releases , October 2025. Figures rounded; 2015 and 2020 approximate per INSG historical narrative.
Reserves tell the same story of southern-hemisphere dominance: Indonesia holds ~62 Mt of the world’s >140 Mt of reserves, followed by Australia (~25 Mt — largely in currently uneconomic deposits), Brazil and Russia. At ~3.9 Mt of annual mine output, global reserves imply a reserve life of roughly 36 years, and identified resources are far larger (>350 Mt, 54% in laterites) — nickel is not geologically scarce. What is scarce is cheap nickel outside Indonesia, and — for Western buyers — nickel with acceptable carbon and political footprints.
Table 9. Nickel reserves by country, 2025 (Mt of contained nickel)
| Country | Reserves (Mt) | Country | Reserves (Mt) |
|---|---|---|---|
| Indonesia | 62 | Philippines | 4.8 |
| Australia | 25 | China | 4.4 |
| Brazil | 16 | Canada | 2.2 |
| Russia | 8.3 | United States | 0.34 |
| New Caledonia | 7.1 | Other | >9 |
| World total | >140 |
Source: USGS Mineral Commodity Summaries 2026: Nickel , February 2026. Reserves are economically mineable estimates; Australian JORC-compliant reserves are ~11 Mt within the 25 Mt figure.
Figure 7. Primary nickel production by country, 2025e (kt)
Source: INSG press releases and Stainless Steel World / INSG review, 2025–2026 (Indonesia 1.9 Mt, China ~27% of world). Rest-of-world split approximate.
2.4 The supply–demand balance
Nickel is consumed, so its balance behaves like an industrial commodity: surpluses build inventories and crush the price, deficits drain them and spike it. And nickel’s balance swings are proportionally the wildest in base metals, because supply arrives in huge, lumpy Indonesian increments while demand grinds upward. The 2010s told the story in both directions: surpluses through 2016 as Chinese NPI scaled, then three straight deficits (~−142 kt in 2017 and 2018) as stainless and early battery demand outran supply. The pandemic flipped the market to surplus, 2021’s stimulus-driven boom produced a deep ~−170 kt deficit, and then the wave broke: the Indonesian build-out has delivered five consecutive surpluses — roughly +100 kt in 2022, +170 kt in 2023, +179 kt in 2024, +209 kt in 2025, and a forecast +261 kt in 2026 (INSG, October 2025). This is the single most important fact about today’s nickel market: supply is structurally outrunning demand, and the INSG expects more of the same.
Table 10. World primary nickel production, usage & balance, 2015–2026f (kt)
| Year | 2015 | 2017 | 2018 | 2019 | 2020 | 2021 | 2022 | 2023 | 2024 | 2025e | 2026f |
|---|---|---|---|---|---|---|---|---|---|---|---|
| Production | ~1,980 | ~2,110 | ~2,180 | ~2,410 | ~2,500 | 2,610 | 3,060 | 3,363 | 3,526 | 3,810 | 4,080 |
| Usage | ~1,890 | ~2,250 | ~2,320 | ~2,440 | ~2,390 | 2,780 | 2,960 | 3,193 | 3,347 | 3,600 | 3,820 |
| Balance | ~+90 | −142 | −142 | −35 | ~+110 | −170 | ~+100 | +170 | +179 | +209 | +261 |
Source: INSG historical balances (deficits ~142 kt in 2017–18, −34.5 kt in 2019) and INSG press releases , October 2025; 2022 surplus per USGS (98.5 kt). 2016 — a final small surplus year before the deficits — is omitted for space. Figures approximate, rounded, and subject to INSG revision — the magnitude and sign, not the precise number, are the point.
Figure 8. Primary nickel market balance, 2015–2026f
Figure data: Table 10.
The shock absorber is visible inventory. Combined LME and SHFE exchange stocks tell the cycle in one line: over 500 kt in early 2016 at the bear-market bottom, drained to a five-year low of ~91 kt at end-2019 after the deficit years, and refilling relentlessly since 2023 — ~290 kt by late 2025, the highest since 2018, with LME stocks including off-warrant metal reaching ~367 kt by end-2025. Against ~3.6 Mt of annual usage, that is roughly four to five weeks of demand — a fatter buffer than copper’s, and one reason the price has stayed pinned. The composition changed too: newly listed Chinese and Indonesian cathode brands now dominate LME stocks (China’s share of LME open tonnage rose from ~47% to ~68% during 2025), a physical marker of who now makes the world’s marginal refined nickel.
At the country level, the market is one giant asymmetry: Indonesia produces ~1.9 Mt of primary nickel and consumes ~0.4 Mt — the rest is exported, overwhelmingly to China — while China produces ~1.0 Mt (from imported feed) and consumes ~2.3 Mt. Everyone else is a rounding error by comparison: the U.S. imports nearly all its primary nickel (net import reliance ~41% of consumption including scrap; nearly 100% excluding it), Europe and Japan/Korea run structural deficits, and the old exporters (Russia, Canada) sell class 1 metal westward and eastward.
Table 11. Nickel net positions, major players, 2025e (kt, primary production vs. usage)
| Country | Primary production | Primary usage | Net position |
|---|---|---|---|
| Indonesia | ~1,900 | ~420 | ~+1,480 (net exporter) |
| Russia | ~200 | ~25 | ~+175 (net exporter) |
| Canada | ~160 | ~15 | ~+145 (net exporter) |
| Japan | ~160 | ~150 | ~+10 (processor) |
| United States | ~0 (no refinery) | ~120 | ~−120 (net importer) |
| China | ~1,030 | ~2,340 | ~−1,310 (net importer of feed) |
Source: production and usage approximated from INSG 2025 estimates and USGS , 2026. Figures approximate; China’s gap is met by imported ore, NPI, matte and MHP — its “deficit” is feed, not refined metal.
Figure 9. Nickel net positions, major players, 2025e (kt)
Figure data: Table 11.
2.5 Supply structure & recycling
How nickel reaches the market matters as much as how much of it there is. The defining structural fact: most primary nickel is now class 2 or intermediate product, not refined metal. Chinese and Indonesian NPI alone (~2.05 Mt in 2025) is over half of primary supply; add ferronickel, matte and MHP and roughly three-quarters of the world’s new nickel never becomes LME-deliverable metal — it flows straight from furnace to stainless mill or from autoclave to battery plant. Class 1 cathode and briquettes are the minority product, though a growing one as Chinese and Indonesian refineries list new LME brands. This is why the LME price alone can mislead, and why product spreads (Section 1.3) carry real information.
On the mine side, nickel is usually the primary product of its mines rather than a by-product — but it rarely travels alone. The sulfide giants earn crucial by-product credits: Nornickel’s nickel comes with palladium, platinum and copper; Sudbury ores carry copper and PGMs; laterite HPAL plants co-produce cobalt (MHP is a major world cobalt source). These credits pull reported nickel costs down and tie parts of the cost curve to entirely different markets. A small slice of world nickel is itself a by-product of copper and PGM mining.
Recycling is the invisible third pillar. Nickel is infinitely recyclable, and stainless scrap — which carries its nickel content with it — supplies roughly a third of the nickel units entering stainless production globally; in the United States, recovered scrap covers about 60% of apparent consumption (there has been no domestic primary refinery since 1985). Scrap is the price-elastic part of supply: collection rises when prices are high. Battery recycling is small today but is the forward story — every EV battery is a future high-grade nickel “deposit”, and a meaningful secondary stream is expected to build from the 2030s as first-generation EV fleets retire.
Table 12. Primary nickel supply by product form, 2025e
| Product form | Class | Approx. share of primary supply | Destination |
|---|---|---|---|
| Nickel pig iron (NPI) | Class 2 | ~54% | Stainless steel (China, Indonesia) |
| Class 1 metal (cathode, briquette, powder) | Class 1 | ~20% | Alloys, plating, batteries, LME |
| Nickel sulfate & chemicals | — | ~12% | Battery precursors |
| Ferronickel | Class 2 | ~8% | Stainless steel |
| Matte, MHP & other intermediates (net) | — | ~6% | Refineries, battery chain |
Source: shares estimated from INSG product data (combined China-Indonesia NPI ~2.05 Mt in 2025 of ~3.81 Mt total) and industry reporting; approximate and rounded — intermediates are partly double-counted into finished products, so shares are indicative of the product mix, not additive tonnes. Recycling shares: USGS (U.S. ~60% from scrap), Nickel Institute (global recycled content ~30%+ in stainless).
2.6 Trade flows & the road through Indonesia
Nickel’s trade map has been redrawn twice in a decade, both times by Indonesian law. Before 2014, Indonesia exported raw laterite ore to Chinese NPI furnaces. The 2014 ore-export ban (and its stricter 2020 successor) forced the furnaces to move to the ore: Chinese groups led by Tsingshan built entire industrial cities in Sulawesi and Halmahera, and Indonesia now exports processed products — NPI, matte, MHP, ferronickel, and increasingly stainless steel and cathode — instead of dirt. The Philippines inherited the raw-ore trade, shipping laterite to the Chinese NPI plants that remain. Class 1 metal from Russia, Canada, Norway and Australia flows to Western consumers and LME warehouses — a flow complicated since April 2024, when the LME (following US/UK sanctions) stopped accepting newly produced Russian metal, redirecting Nornickel’s sales further toward China.
There is no Hormuz in nickel — no single sea lane whose closure severs supply. The chokepoint is jurisdictional: one country’s mines (two-thirds of ore) and two countries’ furnaces (roughly three-quarters of processing). Indonesian mining quotas (RKAB approvals), royalty changes or export rules move the global market the way OPEC decisions move oil; Chinese import appetite and stainless-steel policy set demand for everything Indonesia ships. Concentration, not geography, is the vulnerability every Western critical-minerals strategy is trying to solve.
Table 13. Major nickel trade roles
| Player | Role | Direction |
|---|---|---|
| Indonesia | Dominant exporter of NPI, matte, MHP, stainless | Net exporter (processed products) |
| Philippines | Largest raw-ore exporter | Net exporter (ore → China) |
| China | Largest importer of ore & intermediates; largest refiner-consumer | Net importer (feed) |
| Russia / Canada / Norway / Australia | Class 1 metal suppliers | Net exporters (refined) |
| EU / US / Japan / Korea | Refined-metal & sulfate importers | Net importers |
Source: INSG , USGS and UN Comtrade , 2024–2025.
2.7 Market organisations & supply coordination
Nickel has no OPEC — no treaty organisation sets quotas — but it has something the other base metals lack: a single government whose industrial policy effectively is supply policy. Indonesia controls the marginal tonne, and it manages it actively: annual RKAB mining quotas (whose delays repeatedly tightened ore supply in 2024–25), escalating royalties (raised again in 2025), domestic-processing mandates, and periodic public musing about an “OPEC-style” nickel producers’ organisation — never formed, but a live signal of intent. When Jakarta slows quota approvals, the world’s nickel-ore price rises within weeks.
The formal institutions are softer. The International Nickel Study Group (INSG) — the intergovernmental study group whose member states span the major producing and consuming countries — publishes the authoritative production, usage and balance statistics but sets no quotas. The Nickel Institute is the industry’s market-development and standards body. The exchanges — LME and SHFE — set the rules of price discovery, a role the 2022 squeeze showed to be anything but neutral. And Western governments have made nickel a critical mineral: the U.S. maintains no strategic nickel stockpile of consequence, but policy tools now range from the 2024 sanctions on Russian metal to a 2025 executive order promoting seabed nickel deposits, while the EU and U.S. court “friend-shored” class 1 supply from Canada and Australia.
Table 14. Who shapes the nickel market
| Body / actor | Role | Leverage |
|---|---|---|
| Indonesian government | Quotas (RKAB), royalties, export bans | The de facto swing producer |
| Chinese groups (Tsingshan, Jinchuan, Huayou…) | Own most processing capacity | Set the marginal cost |
| INSG | Intergovernmental statistics & studies | Data, not quotas |
| Nickel Institute | Industry association & standards | Demand-side, advocacy |
| LME / SHFE | Exchanges & price discovery | Reference prices, warehousing |
| US / EU governments | Critical-minerals policy, sanctions | Demand-side rules, friend-shoring |
Source: INSG , Nickel Institute , LME , national policy announcements, 2024–2026.
3. The companies & the value chain
3.1 The largest nickel companies
The corporate league table looks nothing like it did a decade ago. The largest producer by far is Tsingshan Holding Group — a privately held Chinese stainless-steel maker that invented the Indonesian RKEF model and produced a record ~1.12 Mt of nickel units in 2023, roughly a third of world primary supply — yet it is uninvestable for public-market investors and publishes no filings. The listed universe is led by the legacy sulfide majors — Nornickel (the largest class 1 producer, whose Siberian ores carry palladium and copper credits) and Vale Base Metals (Sudbury, Voisey’s Bay, Thompson and PT Vale Indonesia) — plus China’s state-owned Jinchuan, diversified Glencore, and a new generation of Indonesian-exposure listings: Australia’s Nickel Industries (RKEF joint ventures with Tsingshan) and Indonesia’s Harita Nickel (the Obi Island HPAL complex). The most telling entry is an exit: BHP, long the standard-bearer of Australian sulfide nickel, wrote down and suspended its entire Nickel West division in 2024 after Indonesian supply crushed margins — a division-scale casualty of the cost-curve shift. As always in an evergreen guide, companies are sized by durable fundamentals — production, resources, asset quality — never by market capitalisation, which dates a report within days.
Table 15. Leading nickel producers, 2024 (approximate)
| Company | Country | Type | Listing | Output (kt Ni, ≈) | Key assets / note |
|---|---|---|---|---|---|
| Tsingshan Group | China | Integrated NPI-stainless | Privately held | ~1,120 (2023, incl. JVs) | IMIP/IWIP parks, Weda Bay; world #1 |
| Nornickel | Russia | Sulfide major, class 1 | Public (MOEX: GMKN) | 205 | Norilsk-Talnakh; Pd/Pt/Cu credits |
| Vale Base Metals | Brazil/Canada | Sulfide + laterite major | Public (NYSE: VALE) | ~160 | Sudbury, Voisey’s Bay, PT Vale Indonesia |
| Jinchuan Group | China | State miner-refiner | State-owned (HK-listed arm) | ~150 | Jinchang complex; China’s #1 refiner |
| Nickel Industries | Australia | Indonesian RKEF/HPAL | Public (ASX: NIC) | ~130 (attributable) | Tsingshan JV lines at IMIP/IWIP |
| Harita Nickel | Indonesia | HPAL + RKEF | Public (IDX: NCKL) | ~100+ (products) | Obi Island MHP, FeNi, sulfate |
| Glencore | Switzerland | Diversified | Public (LSE: GLEN) | 82 | Sudbury INO, Raglan, Murrin Murrin |
| Sumitomo Metal Mining | Japan | Refiner + stakes | Public (TYO: 5713) | ~80 | Niihama refinery, Ambatovy stake |
Source: company production reports and annual filings, 2023–2024: Nornickel (205 kt, 2024), Vale (~160 kt, 2024), Glencore (82 kt own-sourced, 2024), Tsingshan (privately held, no filings) per Reuters, via Mining.com (1.12 Mt nickel units, 2023); Jinchuan, Nickel Industries and Harita figures are approximate from company reporting (Harita on a product-tonnes basis across FeNi, MHP and sulfate). Listing notes: Nornickel trades in Moscow and is subject to Western sanctions constraints; Jinchuan is Gansu-province state-owned with a Hong Kong-listed subsidiary; Nickel Industries’ output is attributable share of Tsingshan-operated JVs. BHP (Public, ASX: BHP) suspended its ~80 kt/yr Nickel West division into care and maintenance in 2024 (review by 2027). No market-capitalisation figures are shown by design.
3.2 Company archetypes along the value chain
Nickel exposure spans radically different business models, and the 2023–25 shakeout showed how differently they behave. Explorers (largely in Canada, Australia and the U.S., often sulfide hunters) are option value on discovery and on Western friend-shoring premiums. Developers carry the sector’s scars: nickel processing plants — especially Western HPAL builds like Ambatovy and Goro — have a history of multi-billion-dollar overruns, while Chinese-Indonesian builders construct the same capacity in a fraction of the time and capital. Producers split starkly into Indonesian-cost operators (RKEF/HPAL, bottom of the curve, policy risk priced in) and legacy high-cost producers (Australian sulfide, New Caledonian ferronickel) whose survival depends on the price cycle — or on strategic-value support from governments and diversified parents. Integrated stainless/battery groups (Tsingshan, Huayou) capture value across the chain but are mostly private or Chinese-listed. Refiner-traders (Jinchuan, Sumitomo) earn conversion margins. Royalty and streaming exposure barely exists in nickel — a structural gap compared with precious metals — so the low-risk end of the spectrum is thin.
Table 16. Nickel company archetypes
| Archetype | What they do | Revenue model | Price sensitivity |
|---|---|---|---|
| Explorer | Hunt sulfide/laterite deposits | None (raise & spend) | Very high (sentiment) |
| Developer | Permit & build mines/plants | None until production | High + overrun risk |
| Indonesian-cost producer | RKEF/HPAL at curve bottom | Nickel sales − low cost | High, cushioned by margin |
| Legacy/high-cost producer | Sulfide & ferronickel ops | Nickel sales − high cost | Extreme (survival leverage) |
| Diversified miner | Nickel + other commodities | Multi-commodity sales | Medium (blended) |
| Refiner / integrated group | Convert feed; stainless/battery | Conversion & product margins | Low-medium (fee-like) |
Source: company filings; the Metal Pilot project-type taxonomy, 2025.
Figure 10. Nickel company archetypes by price sensitivity
Source: company filings; conceptual, see Table 16.
3.3 Infrastructure & balance-sheet assets
A nickel company’s filings describe a chain of physical assets, and knowing which metric matters for each is what makes the accounts readable. The foundation is the resource and reserve base — tonnes of contained nickel at a stated grade and cut-off, reported under JORC, NI 43-101 or S-K 1300, valued through the mine plan’s net present value. Mines are measured by ore throughput and grade; laterite mines are cheap earth-moving operations, sulfide mines are conventional hard-rock. The heavy capital sits mid-chain: RKEF lines (measured in furnace capacity and power draw — electricity is the dominant cost, which is why Indonesian parks run captive coal plants), HPAL autoclaves (measured by capacity, uptime and acid consumption — the technology’s history of overruns makes delivered capex per tonne the defining metric), smelters and refineries (capacity, recovery, LME brand status), and battery-chemical plants (sulfate and precursor capacity). Watch gross vs. attributable throughout: Indonesian operations are typically juiced joint ventures — Nickel Industries’ output is its percentage of Tsingshan-operated lines; Eramet books its share of Weda Bay’s mine but not the park around it. And by-product credits (Pd, Cu, Co) can swing a reported nickel cost from top quartile to bottom.
Table 17. Nickel-company asset types and metrics
| Asset type | What it does | Key metric | Unit |
|---|---|---|---|
| Reserves & resources | The in-ground nickel base | Contained Ni; grade | Mt; % Ni |
| Mine (laterite / sulfide) | Extract ore | Throughput; strip ratio | Mt/yr; ratio |
| RKEF line | Smelt saprolite → NPI | Furnace capacity; power cost | kt Ni/yr; $/MWh |
| HPAL plant | Leach limonite → MHP | Capacity; capex per tonne | kt Ni/yr; $/t Ni |
| Smelter / refinery | Matte → class 1 metal | Capacity; recovery; LME brand | kt/yr; % |
| Battery-chemical plant | MHP/matte → sulfate/precursor | Sulfate capacity | kt/yr |
| By-product streams | Pd, Pt, Cu, Co credits | By-product credit | $/t Ni |
Source: company reserve statements (JORC / NI 43-101 / S-K 1300) and annual reports, 2024.
4. Investing in nickel
4.1 Ways to own it — exposure vehicles
Physical nickel is off the menu for practical purposes — a tonne of briquettes is a $15,000 pallet of industrial metal with no retail market — so the choice is between paper nickel and nickel businesses. Futures (LME’s 6-tonne contracts, or SHFE for Chinese access) are the direct instrument: leveraged, margined, and — as March 2022 proved — exposed to the health of the exchange itself. Futures-based ETPs wrap the same mechanism for retail buyers and inherit the structural flaw of every futures-tracking product: the fund must roll expiring contracts, and in contango (nickel’s normal state) each roll sells cheap and buys dear — a recurring drag that compounds into serious long-run underperformance versus spot. The canonical demonstration is oil’s 2020 super-contango, when crude-tracking funds lost enormous ground against the spot price they nominally tracked (worked through in the oil guide ); nickel’s contango is normally milder, but the bleed is the same in kind. A futures ETP is a tactical instrument, not a buy-and-hold. For long horizons the practical routes are equities: pure-play producers for maximum leverage (a thin universe after the 2023–24 wipeout — mostly Indonesian-exposure names and surviving Western operators), diversified miners for a cushioned version, explorer-developers for friend-shoring option value, and miner ETFs that bundle the sector. There is effectively no royalty/streaming route in nickel and no physically backed trust of consequence — structural gaps worth knowing before allocating.
Table 18. Ways to own nickel
| Vehicle | What you actually own | Tracks spot? | Key structural cost / risk | Best suited for |
|---|---|---|---|---|
| Futures (LME / SHFE) | Exchange contracts (6 t lots) | Yes, near-term | Leverage, margin calls, exchange risk (2022) | Professionals, hedgers |
| Futures-based ETP | A rolled futures position | Poorly over time | Contango roll drag (see above) | Short-term tactical views |
| Pure-play producer equities | Nickel businesses | No — amplifies | Operating leverage cuts both ways; policy risk | Leverage to the price |
| Diversified miners | Multi-commodity businesses | Loosely | Nickel often a small slice | Core resources exposure |
| Explorer / developer equities | Deposits & projects | No | Financing & overrun risk; binary | Friend-shoring optionality |
| Nickel miner ETFs | A basket of the above | Loosely | Concentration in few liquid names | Diversified sector view |
Source: vehicle structures per LME contract specifications and issuer product documentation; structural attributes only — no fees or prices, which change.
4.2 How to value & screen nickel miners
Nickel screening starts where every mining screen starts — resource base, cost, mine life — but three sector-specific lenses do the real sorting. First, position versus the Indonesian cost floor: Indonesian RKEF and HPAL operations produce at cash costs roughly in the $8,000–13,000/t range (HPAL helped by cobalt credits), and at 2025’s ~$15,000/t average price a large share of non-Indonesian capacity was at or under water — the reason Australian mines closed and BHP suspended a whole division. A Western producer’s investment case must state explicitly why it survives at Indonesian-set prices: grade, by-products, premiums for low-carbon or non-Chinese metal, or government support. Second, product class: a producer of class 1 metal or battery-grade sulfate feed sells into the premium, policy-favoured end; an NPI producer is chained to Chinese stainless margins. Third, by-product reliance: cobalt, PGM and copper credits flatter headline costs and import other markets’ cycles — read costs both gross and net. For developers, capex per tonne of capacity against the Chinese-Indonesian benchmark is the killer metric; a Western HPAL proposal at 3–4× Indonesian delivered cost needs a subsidy story to be financeable. These are exactly the screens — resource base, cost position, reserve life — you can run across every listed nickel producer on Metal Pilot.
Table 19. Nickel-miner screening metrics
| Metric | What it tells you | Good vs. concerning | Where to find it |
|---|---|---|---|
| Resources / reserves (Mt Ni, grade) | Scale and longevity | Larger, higher-grade is better | Reserve statement |
| C1 / AISC ($/t Ni, net of credits) | Cost-curve position | Below ~$13,000/t robust; above ~$16,000/t stressed at recent averages | Annual report / MD&A |
| Product class & customer | Which market you sell into | Class 1 / sulfate favoured; NPI chained to stainless | Company disclosures |
| By-product credit reliance | Cost quality | Modest reliance more durable | Cost notes / MD&A |
| Capex per tonne (developers) | Build competitiveness | Near Indonesian benchmarks; multiples above need justification | Feasibility studies |
| Jurisdiction & policy exposure | Quota, royalty, sanction risk | Diversified or protected positioning | Filings, country policy |
Source: company MD&A and reserve statements, 2024–2025; cost ranges from company reporting and industry cost-curve commentary — approximate, price-dependent bands, not fixed thresholds.
Figure 11. Illustrative nickel cost curve (cash cost vs. cumulative output)
Chart source: illustrative; cost bands from company MD&A and industry commentary, 2024–2025, price line from Table 3. Stylised, not company-level data.
4.3 Macro regimes, rates & correlations
Nickel is a pro-cyclical industrial metal — directionally it behaves like copper , but with more violence and one extra gear: supply-side policy. (For how all the major commodities compare across the same regimes, see the macro regime guide .) Demand rides global industrial production, construction and — through stainless — Chinese fixed investment; since ~2020 the EV cycle adds a second, faster-twitch demand driver. Being dollar-priced, nickel tends to gain when the dollar weakens; being non-yielding and growth-geared, it suffers when tightening chokes activity. But nickel’s biggest regime moves have been supply stories — the 2007 mania (demand boom meeting inelastic pre-NPI supply), the 2014 spike (Indonesian ban), the post-2022 collapse (Indonesian flood) — which is why regime logic alone underdiagnoses this metal.
Historically nickel does best in global expansions and early-cycle recoveries, Chinese stimulus phases, weak-dollar reflations, and supply-restriction episodes; it does worst in recessions and growth scares, China construction downturns, strong-dollar tightening cycles — and, uniquely, in its own supply waves, which can bury it even when world growth is fine (2023–25 is the standing example: prices halved while the global economy expanded). Interest rates work mainly through growth and the dollar rather than through hoarding channels.
Table 20. Nickel across economic regimes
| Regime | Typical nickel performance | Why | Example |
|---|---|---|---|
| Global expansion / early cycle | Strong | Stainless & industrial restock | 2003–2007; 2021 |
| China stimulus / property boom | Strong | Stainless is China-centric | 2009–2011 |
| Falling dollar / reflation | Strong | Dollar-priced, growth-geared | 2020–2021 |
| Supply-restriction shock | Sharp spikes | Bans, quotas, squeezes | 2014 ban; Mar 2022 |
| Recession / growth scare | Weak | Demand destruction | 2008–2009; 2015 |
| Strong dollar, tightening into slowdown | Weak | Dollar + demand headwind | 2015–2016; 2022H2 |
| Own-supply wave (any macro) | Weak | Indonesian capacity outruns demand | 2023–2025 |
Source: long-run price series (IMF/LME ) with growth/CPI data from FRED , author analysis. Regime averages are historical, not predictive.
On past performance, nickel’s long-run record is a lesson in volatility as the price of admission: an investor who bought the 2001–2002 lows (~$6,000/t) saw a six-fold rise to the 2007 annual average, an 80% peak-to-trough collapse by end-2008, a 2010–11 recovery, a five-year grind to the 2016 trough, a doubling into 2021–22, and a 40%+ slide since. Across the full 2000–2025 window the annual average price rose ~75% — well below cumulative U.S. inflation over the period — with drawdowns deeper and more frequent than copper’s. Nickel has historically rewarded cycle timing, not passive holding. Past performance is not indicative of future results.
The equity amplifier. The 2023–24 bust is the concluded case study. LME nickel fell ~45% in 2023 — its worst year since 2008, from around $30,000/t to near $16,000/t — and drifted lower through 2024. The equities did far worse: IGO, the ASX-listed nickel-lithium producer, fell roughly ~78% from its early-2023 peak in under two years while writing off ~A$1.5 bn of nickel assets; Panoramic Resources went into administration in December 2023, wiping out shareholders entirely; and BHP impaired Nickel West by billions before suspending it. Operating leverage plus high fixed costs make nickel equities a geared, noisier version of the metal in both directions — the same mechanism that made Indonesian-exposure producers the sector’s only resilient stocks through the downturn. (Data: LME/IMF price series; ASX price history and company announcements, 2023–2024 — a concluded episode.)
On correlations (monthly data, 2000–2024), nickel is strongly positive with copper (≈ +0.6 — same macro engine), positive with global equities (≈ +0.35) and crude oil (≈ +0.4), negative with the US dollar (≈ −0.35), and only weakly linked to gold (≈ +0.2). Its tightest fundamental links are to Chinese stainless production and, increasingly, global EV output. All of these are sample-dependent, weaker than copper’s equivalents (nickel’s supply shocks scramble them), and they break down in crises — March 2022 correlated with nothing.
Table 21. Nickel correlations (monthly, 2000–2024)
| Asset | Correlation with nickel | Note |
|---|---|---|
| Copper | ≈ +0.6 (strong positive) | Shared industrial cycle |
| Crude oil (Brent) | ≈ +0.4 (positive) | Growth-geared; energy is also a cost input |
| S&P 500 / global equities | ≈ +0.35 (positive) | Risk-on metal |
| US dollar (DXY) | ≈ −0.35 (negative) | Dollar-priced asset |
| Gold | ≈ +0.2 (weak) | No haven behaviour |
| China stainless / PMI | Strong positive | The dominant end market |
Source: author analysis of FRED and IMF/LME series, monthly, 2000–2024. Correlations are time-varying, weakened by nickel-specific supply shocks, and can break down in crises.
Figure 12. Nickel correlations, monthly 2000–2024
Figure data: Table 21.
4.4 Price drivers & cycles
Strip out the noise and nickel’s price is set by a short list of forces, best read through concluded episodes. On the demand side: global and Chinese industrial growth (through stainless), the EV battery cycle (and its chemistry mix — every point of LFP share is nickel demand that never happens), and the US dollar. On the supply side, the list is unusually policy-heavy: Indonesian output and export policy, Chinese processing capacity, the slow response of conventional mines, and — a nickel speciality — market-structure failures. The recurring pattern is asymmetric: demand builds gradually, supply arrives in floods and withdrawals, and the price overshoots in both directions.
The settled case studies: the 2006–2007 mania and crash — booming Chinese stainless demand met pre-NPI supply inelasticity, monthly prices peaked at ~$52,200 in May 2007, and then the invention of NPI plus the financial crisis collapsed the price ~80% to under $10,000 by December 2008 (the crash created today’s industry by proving laterite-to-stainless economics). The 2014 Indonesian ore ban — prices jumped ~50% to near $20,000 by mid-year, then fell back as Philippine ore filled the gap: the market’s first lesson in Indonesian policy power, and a false alarm that made 2020’s real supply shift easy to underestimate. The March 2022 LME squeeze — a concentrated short position met sanction fears; the price doubled in hours to over $100,000, the LME suspended trading and cancelled ~$12 billion of trades, and the episode permanently changed how the market prices exchange risk. And the 2023–2025 supply wave — Indonesian NPI, matte and MHP capacity outran world demand for five straight years, halving the price and forcing the largest wave of Western closures in the industry’s history: proof that in nickel, the cost curve’s bottom sets the price’s ceiling.
Table 22. Nickel price drivers
| Driver | Direction of effect | Why | What to watch |
|---|---|---|---|
| Global / China industrial growth | Faster growth → higher nickel | Stainless is ~68% of demand | PMIs, China property & stainless output |
| EV battery demand & chemistry | More nickel-rich EVs → higher | Batteries ~17% of demand and growing | EV sales; LFP vs NMC share |
| Indonesian supply policy | Restriction → spike; expansion → slump | ~2/3 of mine supply | RKAB quotas, royalties, bans |
| Chinese processing & stainless margins | Overcapacity → lower nickel | Sets marginal cost | NPI prices, stainless spreads |
| US dollar | Weaker USD → higher nickel | Dollar-priced | DXY index |
| Inventories & market structure | Low stocks → spike-prone | Thin class 1 buffer | LME/SHFE stocks; exchange rules |
Source: agency data (USGS , INSG ) and long-run price history. Case studies are concluded historical episodes.
4.5 Risks, controversies & ESG
The bear case and the bull case in nickel share a root: concentration. Policy risk is double-edged — the same Indonesian government that flooded the market could restrict it (quota cuts already tightened ore in 2024–25), and every investment thesis in the sector is, knowingly or not, a bet on Jakarta’s choices. China exposure compounds it: Chinese groups own or feed most processing, so Western tariffs, sanctions or subsidy rules (IRA-style “foreign entity of concern” tests) can redraw who may sell to whom. Demand-side substitution is live and quantified: LFP’s rise already dented battery-nickel demand in 2025, and stainless mills can shift toward lower-nickel 200-series or scrap when prices run. Market-structure risk was demonstrated in 2022 — the benchmark itself froze — and cyclical risk needs no argument after 2008 and 2023.
The ESG ledger is heavy and genuinely contested. Indonesian nickel carries a carbon problem — RKEF NPI smelted with captive coal power is among the most carbon-intensive metal on Earth, an order of magnitude above sulfide class 1 — plus deforestation, tailings and community conflicts documented from Sulawesi to Halmahera and Raja Ampat, and HPAL’s acid-leach residue disposal remains controversial. The legacy producers have their own histories — Norilsk is a byword for Arctic industrial pollution, and its 2020 diesel spill drew a record ~$2 billion Russian fine — while New Caledonia’s industry shows how social instability can halt supply (the 2024 unrest crippled output). Set against this: nickel is essential to the energy transition and infinitely recyclable, and a growing buyer segment pays attention — and eventually premiums — for low-carbon, traceable class 1 nickel, which is the strategic hope of Canadian, Nordic and Australian producers. These are contested questions, and reasonable analysts weigh them differently.
Figure 13. Nickel risk map — likelihood vs. impact
Source: author’s qualitative assessment; see Section 4.5.
5. Future outlook & forecasts
Nickel’s forward story is a tug-of-war between a demand base that the energy transition should roughly double by 2040 and a supply machine that has, so far, grown even faster. Forecasts are scenarios, not measured facts — they hinge on EV adoption, battery chemistry and, above all, Indonesian policy — but the major agencies agree on the shape.
5.1 Demand
The IEA, in its Global Critical Minerals Outlook 2025, projects nickel demand roughly doubling from the mid-3 Mt range today to 2040 under its base-case Stated Policies Scenario (STEPS), with batteries and clean-energy uses taking a rising share on top of steady stainless growth. The near-term path is bumpier than the 2021-era consensus expected: the INSG projects usage growth of ~5–6% a year through 2026 (to 3.82 Mt), driven mostly by Chinese and Indonesian stainless, with battery demand resuming growth after its 2025 dip. The chemistry war is the key demand uncertainty: nickel-rich NMC/NCA retains the range-critical premium segment, but LFP’s cost advantage keeps taking volume share, and each point of share is roughly a permanent haircut to projected battery-nickel demand. Indonesia’s own downstream ambitions add a new demand layer — domestic battery and EV production starting from 2025.
5.2 Supply and the balance
The supply side is the outlook’s controlling variable. The INSG’s committed-project directory counts ~1.95 Mt of new Indonesian primary capacity and ~1.9 Mt of intermediates capacity in the pipeline — enough, if built, to keep the market in surplus well into the 2030s; Macquarie and other analysts see oversupply persisting to 2030 absent policy intervention. The IEA projects the top three producers’ share of mined supply rising to ~85% by 2035 — concentration getting worse, not better. The wildcards cut both ways: Indonesian quota tightening, royalty increases or an export-cartel turn could withdraw supply quickly, while the West’s friend-shoring push (tax credits, price floors under discussion, seabed-mining initiatives) is an attempt to build a parallel, higher-cost supply chain whose economics remain unproven at Indonesian-set prices. One structural gap: the IEA warns that battery-grade class 1 supply could still fall short by 2030 in climate-driven scenarios even amid overall surplus — the market can drown in NPI while starving for sulfate feed.
Table 23. Nickel demand & supply outlook (Mt, scenario figures)
| Indicator (source · scenario) | 2024 | 2025e | 2026f | 2040 |
|---|---|---|---|---|
| Primary usage — INSG | 3.35 | 3.60 | 3.82 | — |
| Primary production — INSG | 3.53 | 3.81 | 4.08 | — |
| Implied balance — INSG | +0.18 | +0.21 | +0.26 | — |
| Total demand — IEA STEPS | ~3.5 | — | — | ~2× today |
Source: INSG press releases , October 2025; IEA Global Critical Minerals Outlook 2025 , 2025. Scenario projections, not measured data; bases differ (INSG primary nickel vs. IEA total demand).
Figure 14. Primary nickel production vs. usage, 2021–2026f (Mt)
Figure data: Table 10 and Table 23. Both series share one scale (max = 4.08 Mt).
5.3 Catalysts to watch
The near-term watch-list is dominated by one capital: Jakarta. RKAB quota approvals, royalty rates and any move toward formal supply management are the fastest-moving price drivers; the INSG’s April and October forecast rounds and the USGS January/February summaries mark the data calendar. Watch LME/SHFE inventories (the surplus made visible), Chinese stainless output and NPI margins (the demand pulse), EV sales and the LFP/NMC split (the structural demand story), and the Western restart/build decisions — BHP’s Nickel West review (due by 2027), New Caledonia’s restructuring, and whether any subsidised Western class 1 project reaches a build decision. What would confirm the bear case: continued Indonesian expansion into a soft stainless cycle. What would break it: a genuine Indonesian supply-management turn, a battery-demand reacceleration, or a major ESG/policy shock to Indonesian-Chinese supply.
Table 24. Nickel catalyst calendar
| Catalyst / theme | Timing | Why it matters | Watch |
|---|---|---|---|
| Indonesian RKAB quotas & royalties | Annual + ad hoc | ~2/3 of mine supply | Ministry announcements |
| INSG balance forecasts | April & October | Supply-demand outlook | insg.org |
| USGS Mineral Commodity Summaries | Annual (Jan/Feb) | Supply & reserves update | usgs.gov |
| Exchange inventories | Continuous | Surplus made visible | LME / SHFE stocks |
| EV sales & battery chemistry mix | Quarterly | Battery demand trajectory | LFP vs NMC share |
| Western capacity decisions | Multi-year | Cost-curve & friend-shoring test | BHP review (2027), New Caledonia |
Source: INSG , USGS and exchange calendars.
6. Summary
Nickel is the alloying metal of the industrial world — the reason stainless steel doesn’t rust and the energy-dense heart of premium EV batteries. Physically it is two markets in one: high-purity class 1 metal priced on the LME, and the far larger flow of class 2 and intermediate products (NPI, ferronickel, matte, MHP) that moves from furnace to mill at negotiated discounts — with the 2022 squeeze a permanent reminder that the benchmark is narrower than the market. Its price is best read as a multi-year average, and the averages tell a brutal cycle: ~$8,600/t in 2000, ~$37,100 at the 2007 mania, ~$9,600 at the 2016 trough, ~$25,900 in squeeze-distorted 2022, and ~$15,200 in 2025 as supply drowned the market. It is mined two-thirds in Indonesia — a concentration no other base metal approaches, anchored by the giant Weda Bay and Morowali complexes — and consumed two-thirds as stainless steel, with China taking ~64% of primary supply and batteries the structural growth pillar at 17%. The balance has run five straight surpluses (+100 to +260 kt) on the Indonesian build-out, refilling exchange inventories to multi-year highs, and the INSG expects the surplus to persist. Supply coordination is informal but real: Indonesian quotas and royalties are the market’s de facto OPEC. The companies split into the untouchable giant (Tsingshan), the legacy class 1 majors (Nornickel, Vale, Glencore), the new Indonesian-exposure listings (Nickel Industries, Harita) and the casualties (BHP’s suspended Nickel West) — compared properly on production, resources and cost position, never market cap. The regime profile is pro-cyclical and dollar-sensitive like copper’s, but repeatedly overridden by supply policy; the durable lesson of 2023–25 is that the bottom of the cost curve sets the ceiling on the price. The single most important variable to watch is Indonesian supply policy, with the EV chemistry mix close behind.
To go from this big-picture view to the actual companies — screening every nickel producer by production, resources and cost position — explore Metal Pilot.
7. Vocabulary
Every specialised term used in this report, defined once at first use in the body, collected here for reference.
Table 25. Nickel vocabulary
| Term | Plain-language definition | Why it matters to an investor |
|---|---|---|
| Sulfide ore | Higher-grade magmatic ore (Norilsk, Sudbury, W. Australia) | The conventional route to class 1 metal; carries by-products |
| Laterite ore | Shallow tropical weathered ore (Indonesia, Philippines) | Now ~2/3 of supply; cheap to mine, energy-hungry to process |
| Limonite / saprolite | Upper (Ni-poor, Co-rich) and lower (Ni-rich) laterite layers | Decides the processing route: HPAL vs RKEF |
| Class 1 nickel | Refined metal ≥99.8% Ni (cathode, briquettes) | LME-deliverable; battery-usable; the premium product |
| Class 2 nickel | Lower-purity NPI and ferronickel | The stainless feed; most of world supply |
| NPI (nickel pig iron) | Cheap iron-nickel alloy (~10–14% Ni) from RKEF furnaces | The invention that remade the market |
| Ferronickel | Higher-grade iron-nickel alloy (~20–40% Ni) | Traditional stainless feed |
| Matte | Smelted intermediate (~70% Ni) | Bridge from NPI/sulfide to class 1 and batteries |
| MHP | Mixed hydroxide precipitate (~35–40% Ni) from HPAL | The battery-chain intermediate; major cobalt source |
| Nickel sulfate | Battery-grade nickel salt (22% Ni) | What cathode makers actually buy |
| RKEF | Rotary kiln electric furnace — smelts saprolite to NPI | Low-capex, coal-powered; the Indonesian workhorse |
| HPAL | High-pressure acid leaching of limonite | Unlocks battery nickel from laterite; overrun-prone in the West |
| NPI-to-matte conversion | Converting stainless feed into battery feed | Links the two markets; announced 2021, crashed the price |
| Payables | % of LME price paid for contained metal in intermediates | The real price of MHP and matte |
| Austenitic (300-series) stainless | Nickel-bearing stainless grades (~8% Ni) | Nickel’s core demand |
| 200-series stainless | Low-nickel stainless substitute | Substitution risk when nickel is expensive |
| NMC / NCA | Nickel-rich lithium-ion cathode chemistries | The battery demand pillar |
| LFP | Lithium iron phosphate — nickel-free cathode | The substitution threat inside the EV boom |
| RKAB | Indonesia’s annual mining work-plan quota approvals | The market’s de facto supply lever |
| Short squeeze | Forced buying by short-sellers driving price spikes | March 2022: +100% in hours, trades cancelled |
| Contango / backwardation | Futures above / below spot | Roll drag in ETPs vs nearby scarcity |
| C1 cash cost / AISC | Direct / all-in sustaining cost per tonne | Who survives at Indonesian-set prices |
| By-product credit | Revenue from Pd, Pt, Cu, Co netted off cost | Can halve a reported nickel cost |
| Reserves vs. resources | Economically mineable vs broader geological estimate | Reserves are bankable; resources are upside |
| Reserve life | Reserves ÷ annual production (years) | Longevity; ~36 years globally |
| Care and maintenance | Suspending a mine while preserving restart ability | The Western industry’s 2023–25 default |
Source: definitions follow JORC / SEC S-K 1300 reserve standards and INSG / Nickel Institute terminology, 2025.
8. Sources, methodology & disclaimer
8.1 Sources, methodology & data vintage
Agencies & official data: USGS Mineral Commodity Summaries 2026: Nickel ; USGS Nickel Statistics and Information ; IMF Primary Commodity Prices / Global price of Nickel (LME) ; FRED (Federal Reserve) for dollar, growth and CPI data; IEA Global Critical Minerals Outlook 2025 .
Industry & exchanges: International Nickel Study Group (INSG) for production, usage, first use and balances, including the October 2025 press release and the World Nickel Factbook 2024 ; Nickel Institute for recycling and applications; LME and SHFE for prices and stocks; UN Comtrade for trade flows.
Company filings & statements: production reports and annual filings for Nornickel , Vale , Glencore , Eramet , Sumitomo Metal Mining, Nickel Industries, Harita Nickel and BHP, 2023–2024; Tsingshan output as reported by Reuters .
Methodology: prices are calendar-year averages (IMF/LME annual averages, 2000–2025), never spot snapshots; the 2022 average is flagged as squeeze-distorted. Mine production and reserves follow the USGS; primary production, usage and balances follow the INSG (with the 2022 surplus cross-checked to USGS). Country usage figures and product-form shares are approximate, assembled from INSG narrative releases; company outputs are from filings on differing bases (attributable vs. 100%, product vs. contained tonnes) as noted under each table. Correlations use monthly data over 2000–2024 and are historical. Reserves, resources and forecasts are estimates, not measured facts; where sources conflict, the more primary and more recent figure is used and the discrepancy noted.
Data as of: 6 July 2026. Intended update cadence: annually, after the USGS Mineral Commodity Summaries (January/February) and the INSG April and October forecast rounds.
8.2 Disclaimer & disclosure
This report is for informational purposes only and is not investment advice, a recommendation, or an offer to buy or sell any security or commodity. Nickel prices are exceptionally volatile, and the figures here are estimates as of the stated date that will change; reserves, resources, correlations and regime averages are estimates and historical observations that may not persist. Do your own research and consult a licensed financial adviser before acting. This report was prepared with the assistance of AI; its figures were sourced from the references above and reviewed, but readers should verify any number before relying on it. The author holds no position disclosed as a conflict in respect of the companies named.